On Kubernetes, MySQL out of connections rarely shows up under its real name. You see pods stuck in Terminating or PodInitializing, liveness probes failing, users getting 502, and all eyes turn to the node, the pod configuration and the ingress. The real root may be one small line in the database log: ERROR 1040 (HY000): Too many connections. This article walks backward from the Kubernetes-side symptoms down to the database, shows how to count connections per user, how to tell limit overcommit from the connection ceiling, and how to stress test properly instead of running parallel kubectl exec.
The model of many websites sharing one MySQL is analyzed in The Database tier: multi-tenant MySQL on small VPS instances, and the multi-layer investigation framework is in Incident investigation across layers: from balancer to database and Kubernetes. This article applies them to a cluster.
Misleading symptoms of MySQL out of connections at the Kubernetes layer
When MySQL out of connections starts rejecting new ones, the PHP application cannot serve probes, so the kubelet may restart the pod; each restart may also open more connections. This is a reasonable hypothesis but was not confirmed in the real case: verify it yourself with kubectl describe pod (the Events section) and compare the restart times against Threads_connected. Common reflexes that do not fix the root cause:
- Adding CPU and RAM to the web pods.
cordonand thendrainthe suspected node.- Separating each site onto its own node. If the error remains after separating, that is evidence the node is not the root cause.
A diagnostic note: PodInitializing does not mean an initContainer is stuck because of the database. Check with kubectl describe pod and kubectl logs pod -c init-name instead of inferring from the status.
Check the database before suspecting the node when MySQL is out of connections
When you suspect MySQL out of connections, log in to MySQL and read four numbers:
SHOW VARIABLES LIKE 'max_connections';
SHOW GLOBAL STATUS LIKE 'Threads_connected';
SHOW GLOBAL STATUS LIKE 'Max_used_connections';
SHOW GLOBAL STATUS LIKE 'Connection_errors_max_connections';
max_connections is the ceiling (the MySQL default is 151). Threads_connected is the current number of connections; if it is close to the ceiling, that is the cause. Max_used_connections is the peak since startup, and Connection_errors_max_connections counts connections rejected because the ceiling was hit. MySQL always reserves one extra connection for an account with administrative privileges, but if the pipeline or you have already used that slot, even the mysql command you type reports error 1040. So open an administrative session before an incident happens.
Reading an all-Sleep processlist when MySQL is out of connections
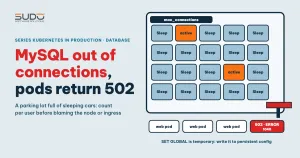
MySQL out of connections does not mean MySQL is busy. A common pattern is a process list that is almost entirely Sleep: connections are open but doing nothing. Count by user and by source:
SELECT user, SUBSTRING_INDEX(host, ':', 1) AS client, COUNT(*) AS n
FROM performance_schema.processlist
GROUP BY user, client
ORDER BY n DESC;

SELECT command, COUNT(*) FROM performance_schema.processlist GROUP BY command;
Since MySQL 8.0.22, information_schema.processlist is marked deprecated, so the example uses performance_schema.processlist; SHOW PROCESSLIST also works. An account without the PROCESS privilege only sees its own threads.
Case one, a confirmed MySQL out of connections: MySQL runs in the cluster (a StatefulSet), with a few dozen users, each holding a few connections from pod addresses, most in the Sleep state. Here there is error 1040 and Threads_connected is close to the ceiling, so concluding that the bottleneck is the connection count is well founded.
Case two, possibly MySQL out of connections: MySQL on a VPS outside the cluster, the processlist has hundreds of rows, mostly Sleep, and the database machine's CPU is only about a third. The two cases look the same in the shape of the processlist, but in case two a connection-count bottleneck is possible and not confirmed, because there is no max_connections value or 1040 log. The way to check is to compare Threads_connected with max_connections.
Why so many connections are open has no answer yet. Directions to verify: persistent connections or a pool on the application side, a wait_timeout that is too large so Sleep connections are never closed, and the number of pods multiplied by the number of PHP-FPM workers for each site.
Why MySQL out of connections is easy to hit when many sites share one server
Each site may hold a few connections per pod, and each pod runs many workers. A simple multiplication: number of sites × number of pods × connections per pod. When dozens of sites share one server, the default of 151 can be hit without any single site behaving abnormally. HPA increasing the pod count for one site also raises this number exactly when load is high (see HPA for Laravel: request-based thresholds, scaling behavior and metrics-server). One way to reduce the risk is to set a convention for the maximum number of databases per server; choose the exact figure from your own measurements.
For a quick fix of MySQL out of connections, you can raise the ceiling temporarily with this command:
SET GLOBAL max_connections = 300;This takes effect immediately but is lost when MySQL restarts. With MySQL 8.0 or later you can use SET PERSIST max_connections = 300. The other way is to write it into the persistent configuration:
[mysqld]
max_connections = 300
For MySQL running in the cluster, put this [mysqld] block in a ConfigMap mounted at /etc/mysql/conf.d and roll out again; editing my.cnf directly inside the container is lost when the pod is recreated. Raising the ceiling also costs RAM, because each connection allocates its own buffers (see sort_buffer_size, join_buffer_size). Raising the ceiling only buys time before MySQL out of connections happens again; the root is the source of the open connections.
Limit overcommit on the node: a risk, but not the culprit
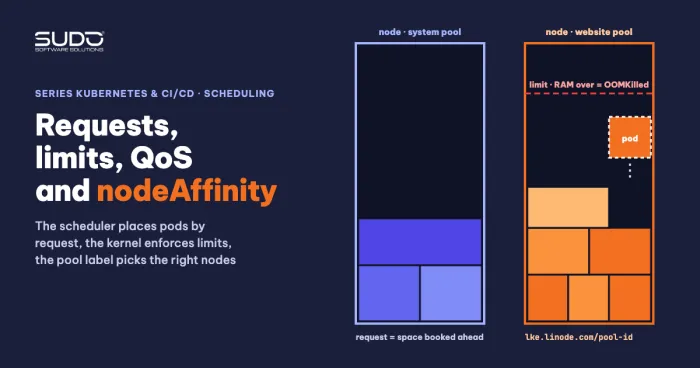
When monitoring nodes, you may see total limits many times larger than real capacity (overcommit). That is a risk worth noting, especially for RAM (see Node out of RAM: slow sites with low CPU, limit overcommit and NotReady nodes, and how to set requests and limits in Requests and limits, QoS and nodeAffinity: placing pods on the right nodes). But in the case of MySQL out of connections with error 1040, overcommit is not the culprit: after separating each site onto its own node, the error remained, meaning the node was not the root cause. High overcommit only indicates a risk; it does not prove a cause.
Stress testing properly with a load pod
To check whether MySQL out of connections can be reproduced, many people write a script that calls kubectl exec in parallel into the MySQL pod. This approach is misleading:
- Running about fifty
kubectl execstreams at once may produce errors like "error sending request" to the API server. The reason is unconfirmed; saying the API server is "rate limiting" is only a guess. - Exec is an administration channel, not a load channel. All command arguments, including a password passed with
-p, are placed in the exec request URL; do not put passwords in command arguments. - Comparing
kubectl execwithdocker execis not fair, because the channel and the target differ; do not treat the result as a measurement.
The right way is to create a dedicated load pod, running in the same cluster, connecting straight to the MySQL Service like a real application:
apiVersion: v1
kind: Pod
metadata:
  name: mysql-load
  namespace: database
spec:
  restartPolicy: Never
  containers:
  - name: load
    image: registry.example.com/mysql-client:<version>
    envFrom:
    - secretRef:
        name: mysql-load-secret
    command: ["/bin/sh", "-c"]
    args:
    - |
      for i in $(seq 1 50); do
        ( while true; do
            mysql -h db-1 -u "$MYSQL_USER" "$MYSQL_DB" -e "select sleep(60)" >/dev/null
          done ) &
      done
      wait
The password comes from a Secret through the MYSQL_PWD environment variable (the mysql client reads this variable), and is not written in the manifest or in command arguments, so it is not exposed in ps. The select sleep(60) query keeps the connection open to simulate Sleep connections; a select 1 loop that opens and immediately closes cannot reproduce the held-connection situation. To hit the ceiling, the number of streams must exceed max_connections minus the existing connections (with a ceiling of 151, 50 streams is not enough), or temporarily lower max_connections in a test environment. Try it on a test MySQL, not on production, then increase the number of streams gradually and watch Threads_connected along with Connection_errors_max_connections. This article gives no sample figures because there is no results table.
Alerting and preventing MySQL out of connections
- An early warning before MySQL out of connections: when
Threads_connected / max_connectionsexceeds about 80% for a few minutes. This is a recommendation to verify in your own environment. The metrics come frommysqld_exporter(see Installing mysqld_exporter on Kubernetes: three silent errors that leave Prometheus empty). - Set
max_connectionsin the persistent configuration, not only withSET GLOBAL, so MySQL out of connections does not return after a restart. - Set reasonable
wait_timeoutandinteractive_timeoutvalues to clean up Sleep connections. - Calculate in advance the maximum total connections of all sites when HPA scales up, so MySQL out of connections does not strike exactly when load is high.
- Use a dashboard that shows the processlist for easy viewing, with a read-only user that has the
PROCESSprivilege.
On whether to run MySQL inside the cluster at all, see MySQL in Kubernetes or outside the cluster: why we moved the database to a VPS. Source documentation: MySQL's Too many connections error handling.
What is still unresolved
- The source of the many open connections behind MySQL out of connections in the first case: not found.
- The mechanism from MySQL out of connections to
TerminatingandPodInitializing: only a correlation in time so far, causation not proven. - In the case of MySQL outside the cluster, the site recovered after the database machine was upgraded; but a restart also clears connections, so we cannot write "adding CPU or RAM is the cure". That case lacks the
max_connectionsvalue and the 1040 log, so it is only a suggestive sign. - The maximum number of databases per server to avoid MySQL out of connections: no convention yet, choose from your own measurements.
Series wrap-up
The series closes with one shared lesson, after going from foundational errors (PVC, Pending, nodes out of RAM, cert-manager) through data, security, resources and autoscaling: symptoms at the Kubernetes layer are often just the shadow of another layer. A 502 can originate from MySQL out of connections, a hanging site can be caused by HPA hitting its cap, a slow site can be caused by a webroot on NFS. A consistent diagnostic order (pod, Service, node, then storage and database) saves more time than any single command.
If you are just starting, reread the Kubernetes & CI/CD series. To go deeper by topic: Cluster Autoscaler on LKE: Pending pods, NotTriggerScaleUp and HPA at maxReplicas for autoscaling, Webroot on NFS hanging: measuring PHP sites with fio, ioping and iperf3, and when to drop NFS for shared storage, and 503 errors when a Service has no Endpoints: a Kubernetes troubleshooting checklist for the networking checklist.