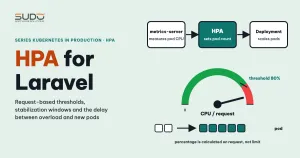
A single line, targetCPUUtilizationPercentage: 90 in values.yaml, is enough to give a Laravel website an HPA (HorizontalPodAutoscaler) that adds pods when load grows. But once you enable HPA and run a load test, the real questions show up: 90% of what, how long until it adds pods, how long until it removes them, and why the site still dies before the new pods are up. This article covers the mechanics: where HPA gets its numbers, the formula for the pod count, why the threshold is calculated on request, how to tune behavior, and how to install metrics-server correctly.
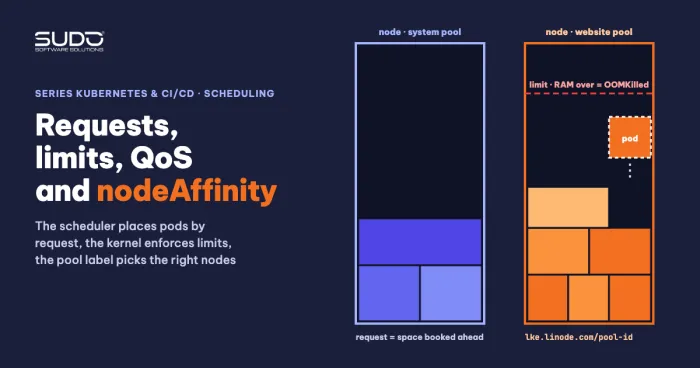
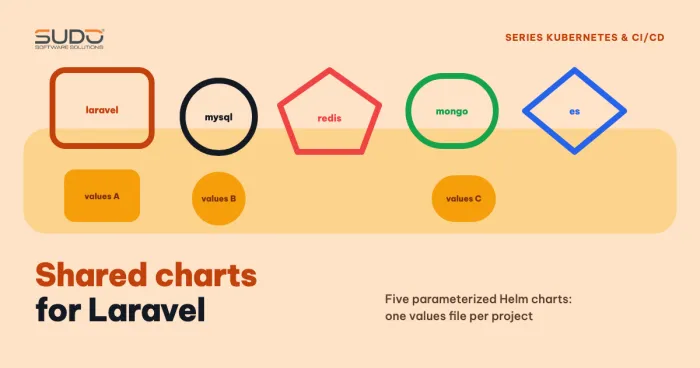
Declaring HPA with a single values line is covered in What is a Helm chart: packaging Laravel websites for repeatable deploys. Setting requests and limits correctly is covered in Requests and limits, QoS and nodeAffinity: placing pods on the right nodes, and pm.max_children in pm.max_children for PHP-FPM pods: choosing requests and limits, and why short stress tests mislead.
Where HPA gets its numbers: metrics-server
HPA does not measure CPU itself. It queries the Metrics API (metrics.k8s.io), which is served by metrics-server by collecting data from the kubelet on each node. Without metrics-server, neither kubectl top nor HPA has any data. The typical symptom:
kubectl top pods -n site-a
error: Metrics API not available

kubectl get hpa -n site-a
NAME     REFERENCE         TARGETS         MINPODS   MAXPODS
site-a   Deployment/web    <unknown>/90%   1         3
When the TARGETS column shows <unknown>, HPA cannot read the metrics yet. Before installing anything, check whether the cluster already has it, because some providers ship metrics-server by default and others do not:
kubectl get deployment metrics-server -n kube-system
kubectl get apiservice v1beta1.metrics.k8s.io
kubectl get --raw /apis/metrics.k8s.io/v1beta1/nodes
If you need to install it, pin a specific version of components.yaml instead of latest, so the next install gives the same result as this one (replace <version> with a version you have verified is compatible with your cluster):
kubectl apply -f https://github.com/kubernetes-sigs/metrics-server/releases/download/<version>/components.yaml
kubectl rollout status deployment/metrics-server -n kube-system
If the metrics-server pod is running but the API still reports it is unavailable, a common workaround is to add the --kubelet-insecure-tls flag to the container args. This flag skips verification of the kubelet certificate, so use it for testing only. The real cause (usually a kubelet certificate that does not match the address metrics-server connects to) should be confirmed with kubectl logs -n kube-system deploy/metrics-server.
The HPA formula for the pod count
On every cycle (15 seconds by default), HPA calculates:
desiredReplicas = ceil[ currentReplicas * ( currentMetricValue / desiredMetricValue ) ]For example, with 3 pods, a target of 50% and a current average usage of 170%, the ratio is 3.4, so 3 × 3.4 = 10.2, which rounds up to 11 pods. Two details to remember. First, if the ratio is within the tolerance (default 0.1, about 10%), HPA does nothing. Second, the result is always capped by minReplicas, maxReplicas and the policies in behavior. The 15-second cycle, the tolerance and the default stabilization time are kube-controller-manager flags; on a managed cluster you usually cannot change them, so the practical approach is to use spec.behavior as described in the sections below.
The Utilization threshold is calculated on request, not limit
For a Utilization metric, HPA divides each pod's usage by that pod's resources.requests and then averages the results. Not the limit, and not the node capacity. The consequences:
- Every container in the pod must declare a CPU request. Without a request, HPA cannot calculate a percentage.
- The smaller the request, the easier it is to exceed the threshold. A pod with a
200mrequest and a 90% threshold is considered overloaded at about180mof usage, even if the limit is a full core. This is an inference from the formula, not a measurement. - When someone says "CPU is at 100%", ask 100% of what: the request, the limit or the whole node. These three numbers are very different.
A request set too low also makes nodes fill up unexpectedly, as analyzed in Node out of RAM: slow sites with low CPU, limit overcommit and NotReady nodes.
One more detail about newly started pods: when calculating the average, HPA ignores pods that are not Ready and pods that started within --horizontal-pod-autoscaler-cpu-initialization-period (default 5 minutes, a kube-controller-manager flag), so the CPU spike at startup does not skew the calculation. This is why the readiness probe affects HPA. The details are in the official documentation linked at the end of this article.
Behavior: scale up fast, scale down slowly
The spec.behavior field controls how fast the replica count changes. The default values are equivalent to:
behavior:
  scaleDown:
    stabilizationWindowSeconds: 300
    policies:
    - type: Percent
      value: 100
      periodSeconds: 15
  scaleUp:
    stabilizationWindowSeconds: 0
    policies:
    - type: Percent
      value: 100
      periodSeconds: 15
    - type: Pods
      value: 4
      periodSeconds: 15
    selectPolicy: Max
stabilizationWindowSeconds is not a countdown timer. HPA stores the recommendations within that window and picks the highest recommendation when scaling down (or the lowest when scaling up), so when load has just dropped, the pod count only falls after every recommendation in the window is low. You can verify this yourself: set scaleDown.stabilizationWindowSeconds to 300 and lower the load, and the pod count only drops after about 5 minutes. With scaleUp.stabilizationWindowSeconds set to 60, new pods only appear about 60 seconds after the threshold is exceeded. This article has not compared a 0-second and a 60-second scale-up on the same scenario, so measure it yourself before choosing a value.
A common misunderstanding is "the pod count keeps doubling, 3 to 6 to 12". In reality each cycle is capped by the policies and maxReplicas. With 3 pods, the Percent 100 policy allows adding 3 (to 6), and the Pods 4 policy allows adding 4 (to 7); selectPolicy: Max picks the policy with the larger result, which is 7.
For a site with a single 1-core node, a long scale-up window makes no sense: you already wait for HPA, then for the pod to start, and possibly for a new node. Keep the default scale-up (0 seconds) and only lengthen scale-down.
Why one heavy operation kills the site before it scales
Suppose an operation such as activating a theme or generating content in bulk pushes CPU to the ceiling immediately. HPA's chain of reactions has a delay at every step: metrics-server samples periodically, HPA syncs every 15 seconds, then the new pod must pull the image, start PHP-FPM and pass the readiness probe; if the node is full, it must also wait for the Cluster Autoscaler to add a new node (the topic of the next article). In the meantime, the existing pods keep receiving requests, get CPU-throttled, respond slowly or time out, and may be restarted if the liveness probe fails before the new pod is ready. HPA is a feedback loop, not a shield against sudden load. Ways to reduce the risk: set minReplicas to 2 or more for important sites, push heavy work to a queue, and do not set the threshold close to 100%.
Absolute metrics instead of percentages
If a percentage of request makes HPA too sensitive, you can set the threshold as an absolute value. For CPU and memory, use AverageValue; this needs no adapter:
metrics:
- type: Resource
  resource:
    name: cpu
    target:
      type: AverageValue
      averageValue: 400m
For metrics other than CPU and memory (for example CPU from a Prometheus rate, or requests per second), you need an adapter such as Prometheus Adapter to expose the metric in custom.metrics.k8s.io, and then declare type: Pods. Verify with kubectl get --raw /apis/custom.metrics.k8s.io/v1beta1. In our experience, memory is a poor metric for PHP-FPM because workers hold on to memory after finishing a request, so the pod count is hard to bring back down; this is a rule of thumb, not a hard rule.
Sample YAML and a diagnostic checklist
apiVersion: autoscaling/v2
kind: HorizontalPodAutoscaler
metadata:
  name: site-a
  namespace: site-a
spec:
  scaleTargetRef:
    apiVersion: apps/v1
    kind: Deployment
    name: web
  minReplicas: 2
  maxReplicas: 5
  metrics:
  - type: Resource
    resource:
      name: cpu
      target:
        type: Utilization
        averageUtilization: 80
  behavior:
    scaleDown:
      stabilizationWindowSeconds: 300
      policies:
      - type: Pods
        value: 1
        periodSeconds: 60
Note: targetCPUUtilizationPercentage is the field name in autoscaling/v1 and also the values name that charts commonly use; in an autoscaling/v2 manifest the equivalent field is metrics[].resource.target.averageUtilization, as shown above. Do not copy values into a manifest as if they were the same thing.
- Does
kubectl top podswork? If not, check metrics-server and the APIService. kubectl get hpa: is theTARGETScolumn<unknown>? If it shows<unknown>, check in this order: metrics-server and the APIService, then containers missingresources.requests.cpu, then errors in theEventsofkubectl describe hpa.kubectl describe hpa: readConditionsandEvents, and look for a line saying the desired replica count exceedsmaxReplicas.- Compare the percentage with the pod's real request, not with the limit.
- Check whether
behavioris blocking the scaling step. - HPA has hit its cap or new pods are Pending: switch to diagnosing the node layer.
Source documentation: Horizontal Pod Autoscaling from Kubernetes.
Flags such as the sync period and the tolerance belong to the control plane; this article has not measured how long a new pod takes to become Ready or a new node to become available, so measure on your own cluster before setting maxReplicas.
Next article
Cluster Autoscaler on LKE: Pending pods, NotTriggerScaleUp and HPA at maxReplicas. HPA changes the pod count; when new pods are Pending because there is no room, adding nodes is the job of a different component.