A Laravel pod runs nginx, PHP-FPM, cron and a queue worker in a single container. Even when nobody visits the site, kubectl top pod still shows a noticeable baseline of RAM and CPU. Then comes load testing, and the result depends on how long you measure: a short test easily feels fine, while a one-hour run at a high level starts producing 503 errors. This article describes a one-variable-at-a-time method for pm.max_children and the other pm.* settings in a pod: measure the idle pod, adjust the configuration, convert real traffic into requests per minute, and only then choose request and limit.
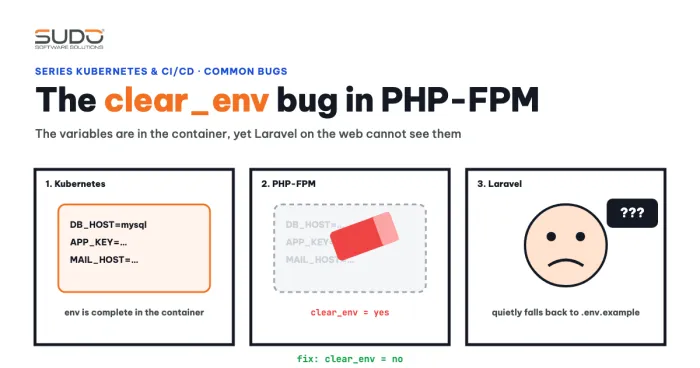
This article does not cover a static formula for computing the limit from the PHP configuration; it focuses on the measuring process and the places where it is easy to draw the wrong conclusion. For how PHP-FPM loads environment variables and www.conf, see The clear_env bug: Laravel in a container cannot read environment variables.
Symptom: an idle pod still uses resources because of pm.max_children and start_servers
A common sign is a pod that has received no requests, yet kubectl top pod still shows hundreds of MiB of RAM and a non-zero baseline CPU. Look at the process list inside the container and you see many php-fpm: pool www processes at once. That number comes from configuration, not from PHP itself, and pm.max_children is only a ceiling, not the number of workers running: images usually ship a ready-made www.conf file (many images set pm = dynamic) with pm.start_servers and pm.min_spare_servers values chosen by whoever built the image. Do not claim that "PHP-FPM opens many workers by default"; check the configuration that is actually in effect.
PHP-FPM in an all-in-one container and how to read memory
In an all-in-one image, supervisord starts nginx, a php-fpm master and several workers, plus queue:work and cron. When you run busybox top (Alpine images), the memory column is VSZ, the virtual memory allocated, not real memory. A worker showing 238m of VSZ may use only a few dozen MiB in reality. The number to compare against the limit is the cgroup working set, which is also what kubectl top pod shows. To look at each process, read VmRSS:
kubectl -n site-a exec deploy/app -- sh -c \
  'for p in $(pgrep php-fpm); do grep -H VmRSS /proc/$p/status; done'

kubectl -n site-a top pod --containers
Note that workers share memory pages (opcache, libraries), so adding up the RSS of all workers gives more than the real usage. Use the cgroup total as the reference, and use per-worker RSS only to estimate how much each worker uses.
Adjusting pm.max_children and checking the effective configuration
For a site with moderate traffic, lowering pm.max_children and the number of pre-started workers is the first way to reduce idle usage. A sample test configuration:
pm = dynamic
pm.max_children = 20
pm.start_servers = 2
pm.min_spare_servers = 1
pm.max_spare_servers = 3
What it means: pm.max_children of 20 is at most 20 workers, 2 at startup, and always between 1 and 3 idle workers. The binary name depends on the version (for example php-fpm82 on Alpine). To check the configuration that is actually loaded, with all includes merged, use -tt:
kubectl -n site-a exec deploy/app -- php-fpm82 -tt 2>&1 | grep -E "pm(\.[a-z_]+)? *="Each output line has a timestamp and NOTICE: prefix, so the grep pattern is not anchored to the start of the line.
The -tt command prints the processed configuration and exits, so it does not affect the running process.
There are two caveats for pm.max_children in particular and pm.* in general. First, editing www.conf through kubectl exec lasts only until the next restart: put the file in the image or mount it from a ConfigMap. Second, a before-and-after comparison must use the same conditions: compare an idle pod only with an idle pod, and record rounded values. In one typical experiment, idle RAM and CPU dropped noticeably after the worker count was lowered, but do not compare that figure with a pod under load.
Converting real traffic into requests per minute
To choose a sensible pm.max_children, you need to know the real load, because this value only means something when tied to a level of concurrent requests. Requirements are usually stated as page views per minute, while tools such as JMeter, Locust or k6 need requests per minute. One page view triggers several requests (HTML, API, images), but PHP-FPM only handles the dynamic ones. Count from the nginx log, group by minute, exclude static files, then take the normal level and the peak. The process should be: pick a few levels (light, medium, heavy) and a few representative pages (home, category, detail). Run each level separately and record the error rate as a percentage together with peak CPU and RAM.
Why short stress tests can miss problems
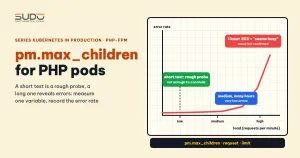
A run of a few minutes per page is enough for a rough probe of resource use and an initial pm.max_children value. It can be unreliable for three reasons, and all three are not verified in this example: the cache is still warm, so repeated queries are very cheap; the dynamic worker count has not gone through many "grow then shrink" cycles; and background jobs such as the queue and cron have not had time to pile up. In one typical experiment, with the same configuration and a low request:
- High level for one hour: 503 errors appeared, page load times were very slow, and the log had PHP-FPM warnings.
- Medium level for one hour: no errors.
- The same medium level for 24 hours: a very low error rate, but not zero.
This is worth saying about method: a high load level only reveals errors when it runs long enough. This data does not prove that a short test gives a wrong conclusion, nor that 24 hours reveals anything more than one hour. Treat it as guidance: a conclusion is only trustworthy at a duration comparable to the site's real usage.
Reading logs and measurements to find the cause
When a test fails, collect three sources: the PHP-FPM log, pod usage, and CPU throttling.
# 1. PHP-FPM warnings
kubectl -n site-a logs deploy/app | grep "seems busy"
# WARNING: [pool www] seems busy (you may need to increase
# pm.start_servers, or pm.min/max_spare_servers), spawning 16 children,
# there are 0 idle, and 18 total children

# 2. Actual usage
kubectl -n site-a top pod --containers

# 3. CPU throttling (Prometheus)
# rate(container_cpu_cfs_throttled_periods_total[5m])
#   / rate(container_cpu_cfs_periods_total[5m])
The "seems busy" message says that at that moment there was no idle worker left and PHP-FPM was spawning more. But in the example above there were only 18 workers, short of the pm.max_children = 20 ceiling. So you cannot yet conclude that the 503 came from pm.max_children or the other pm.* settings. There are at least three hypotheses: pm.max_children or the spare pool is too small for the load, CPU is throttled because of a low limit so each request slows down, or the PHP code itself is slow. This example has no throttling measurements, so all three remain open. Verify by changing one variable at a time and rerunning the same load.
It is also necessary to tell a 503 apart from other codes. When FPM has no workers left, nginx inside the pod usually returns 502 or 504. A 503 from the ingress appears when the Service has no ready endpoints, for example when the readiness probe calls into the same stuck pool and fails. Separate out a lightweight probe path as described in Health endpoint for Laravel on Kubernetes: what to check and which probe to use.
Request and limit: do not set the request below real usage
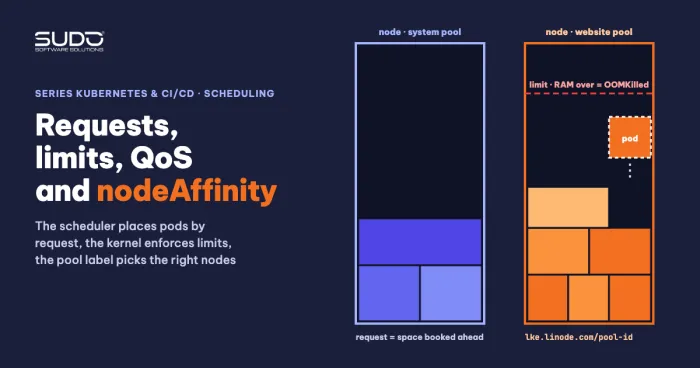
The general rule is that request is the amount of resources the scheduler guarantees and limit is the ceiling. The mechanism is explained in Requests and limits, QoS and nodeAffinity: placing pods on the right nodes. The trap to avoid is lowering request close to the idle level (for example 100m CPU) while everyday usage is much higher. With an HPA based on CPU averageUtilization, the percentage is computed against request, so the pod nearly always exceeds the threshold and the HPA keeps adding replicas. Choose a request close to usage at normal load (not when idle), and a limit that covers the peak.
Also do not derive pm.max_children from CPU alone: each worker needs RAM, so the product of the worker count and RSS must fit within the memory limit. A limit that is too low, for CPU or memory, has made sites prone to hanging under high traffic: low CPU causes throttling that slows requests, and low memory gets processes OOM-killed. Check with kubectl describe pod (Last State: OOMKilled) and the throttling metric.
resources:
  requests:
    cpu: 300m        # usage at normal load, not when idle
    memory: 400Mi
  limits:
    cpu: "1"
    memory: 1Gi
The numbers above are only illustrative examples, not recommended values for every site. Assuming each worker uses about 40 to 60MiB of RSS, 20 workers at the maximum take about 0.8 to 1.2GiB, so a 1Gi limit is tight; measure the real RSS and then choose.
Limits of this method for choosing pm.max_children
- Measure one variable at a time: change
pm.max_childrenwhile keepinglimitfixed, and the other way around. - Each time you change
pm.max_children, measure worker RSS again so the product still fits within the memory limit. - Record the error rate as a percentage for each run, together with the run length.
- The pod's baseline RAM includes both FPM and the queue worker; each component's share needs to be separated when measuring.
- The final configuration (
pm.max_children,request,limit) should be fixed after measuring, and the standard traffic level must be defined in advance.
The pm.* settings are fully described in the PHP-FPM configuration documentation. For setting resources on containers, see the Kubernetes resource management documentation. How to package Laravel into one shared image is covered in Dockerizing Laravel: one all-in-one image for Website AI.
Checklist
- Measure the idle pod first, using the working set and
VmRSS, not VSZ. - Check the effective
pm.max_childrenwithphp-fpm -tt; putwww.confin the image or a ConfigMap. - Convert real traffic into requests per minute from the nginx log.
- Run at least one load level for a long time; record the error rate as a percentage.
- Read the "seems busy" log,
kubectl topand throttling before blamingpm.max_children. - Record the effective
pm.max_childrenvalue together with the load level and run length of each run. - Set
requestby normal load, especially when the HPA is based on CPU.
Next article
503 errors when a Service has no Endpoints: a Kubernetes troubleshooting checklist. When a 503 appears, the next article goes layer by layer through Ingress, Service, Endpoints, pod and node to find the cause.