A Laravel website runs on several pods, and to let the pods share one directory, that directory is mounted from an NFS server. Everything works well until the site starts hanging in waves: the pods are not out of RAM, the database is not full, disk space is plentiful, but pages do not load. Simply unmounting NFS from the pod makes the site stable again, and that points to NFS as the suspect. This article describes how to diagnose each layer when a webroot on NFS hangs: measuring disk with fio and ioping, measuring the network with iperf3, reading the results correctly, common measurement mistakes, the monitoring that a "disk full" alert does not catch, and when to drop NFS for the webroot.
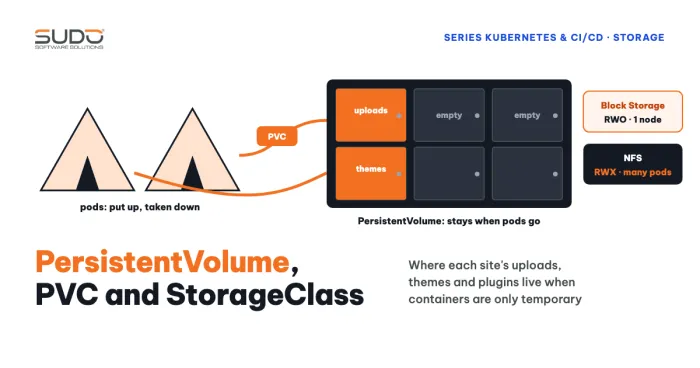
The fundamentals of volumes and ReadWriteMany are in Volume, PersistentVolume, PVC and StorageClass on Kubernetes, which includes a section on static NFS with a PersistentVolume. Monitoring the NFS server with node_exporter builds on Kubernetes monitoring with kube-prometheus and Grafana.
Symptoms of a hanging webroot on NFS
- The site hangs or becomes very slow in waves.
- The web pods, the database and the NFS disk capacity are all normal, but the webroot on NFS is still slow.
- When the pod runs without the NFS mount, the site is stable.
These three signs only show that a webroot on NFS is a reasonable suspect, not a conclusion. The "still unresolved" section at the end spells out what needs further verification.
Why a webroot on NFS slows PHP down
When code lives on NFS, each PHP request usually touches dozens to hundreds of small files: index.php, autoload files, views, config. On a local disk, metadata operations (stat, open) are cheap. Over NFS, each metadata operation is a round trip over the network to the server. With opcache.validate_timestamps=1, PHP still re-stats files every opcache.revalidate_freq (default 2 seconds), and on NFS every stat is a network round trip. The NFS client caches attributes (acregmin, acdirmin), but every open still revalidates with the server under close-to-open semantics.
Increasing realpath_cache_size and running composer dump-autoload -o reduce the number of files that must be touched. When many pods read at the same time, one small NFS server becomes a shared bottleneck for the whole site. People still use NFS because block PVCs usually only support ReadWriteOnce.
Measuring the disk of a webroot on NFS with fio and ioping
For a webroot on NFS, measure directly on the NFS server (local disk) and from inside a pod on the mounted directory. A sample command for 4k random reads:
fio --name=fiotest --filename=/mnt/data/testfio --size=2G \
    --bs=4k --iodepth=64 --ioengine=libaio --direct=1 \
    --rw=randread --runtime=60 --time_based

ioping -c 20 /mnt/data
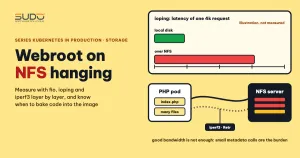
ioping reports the latency of a single small request, which is usually the most meaningful figure for a website: on a local disk it is typically a few hundred microseconds, and over NFS it is noticeably higher (typically from a few hundred microseconds up to around a millisecond), because each request crosses the network. With fio, IOPS inside a pod on NFS is usually lower than on a local disk; read the results as a range, since each run varies.
Common measurement mistakes
- Comparing different things when measuring a webroot on NFS. Measuring on the NFS server measures a local disk; measuring in the pod measures through the network and the NFS client. The difference between the two results includes the network and the protocol, not just "a slow disk".
direct=1bypasses the page cache. For a website, the kernel cache and opcache play a large role, so O_DIRECT numbers are lower than real repeated file reads. It answers "what is the disk's maximum", not "what does the site experience".rwmixreadonly affects mixed workloads (--rw=rworrandrw). Passing--rwmixread=75together with--rw=randreadmakes the parameter ignored; this is a very common copy-and-paste mistake.- A deep queue does not simulate a website. 4k blocks with
iodepth=64measure how well the device handles a queue, not opening hundreds of small files in parallel. - Do not say "N times slower" from two runs under different conditions. Only conclude when parameters are the same and the test is repeated several times.
To get closer to a real website, add one realistic measurement: time a command that walks many small files (for example find with stat on the code directory) in both places. For NFS there are also tools that measure the right thing better than fio:
nfsiostat 5
nfsstat -c
cat /proc/self/mountstats
nfsiostat (or mountstats) gives the average RTT for each operation type such as GETATTR, LOOKUP and READ, plus the retransmit count, so it reflects the metadata cost of the webroot accurately. Record the mount options (noatime, nconnect, actimeo) and whether the export is sync or async when comparing.
Measuring the network to the NFS server with iperf3
# on the NFS server
iperf3 -s

# in the pod
iperf3 -c 10.0.0.31            # pod to NFS direction, single stream
iperf3 -c 10.0.0.31 -R         # reverse direction
iperf3 -c 10.0.0.31 -P 4       # four parallel streams
A default run measures only one direction and one stream. A result of a few Gbit/s shows that raw bandwidth is not the bottleneck, but also read the Retr column (packets that had to be retransmitted): a consistently high value is a signal to investigate further (packet loss, NIC queues, pod CPU limits, an overloaded receiver), though not enough to conclude anything. You can cross-check with a single-stream test using netcat:
# on the NFS server
nc -l -p 12345 > /dev/null

# in the pod
dd if=/dev/zero bs=1M count=1024 | nc 10.0.0.31 12345
The netcat number may differ from iperf3 because it is a different tool, uses a single stream, and a different destination address (private or public network) takes a different path; this is a hypothesis to verify. Bandwidth is not latency: a fast link can still be slow for thousands of small metadata requests.
The server side when a webroot on NFS is overloaded
When a webroot on NFS is slow, two commonly forgotten parameters are the NFS server's CPU and the number of nfsd threads. A small machine (1 core, 1 GB) easily hits 100% CPU during a load test, while the average chart still looks normal because the peak lasts only a few seconds. The default thread count (usually 8) may also be too low for many clients.
cat /proc/fs/nfsd/threadsTo make the setting persistent, create the file /etc/nfs.conf.d/local.conf with this content:
[nfsd]
threads=20
Then apply it with sudo systemctl restart nfs-server. Restarting nfs-server makes NFS clients stall on I/O for a moment, so do it outside peak hours; or try it quickly with echo 20 | sudo tee /proc/fs/nfsd/threads (lost on reboot).
For a webroot on NFS, verify with /proc/fs/nfsd/threads instead of trusting ps. For example, a 1-core, 1 GB NFS server easily hits 100% CPU during a load test; upgrading the machine and increasing the threads got the load test past full CPU, but the site could still hang. So the NFS server CPU is the strongest suspect but is not fully proven, and there is also no basis for concluding "NFS is not overloaded".
Monitoring a webroot on NFS: a disk-full alert is not enough
When monitoring a webroot on NFS, a disk-full percentage alert only catches running out of space, not CPU or IOPS problems. On the NFS server, install node_exporter (run as a systemd service, not backgrounded with &) and add a static scrape job to Prometheus:
prometheus:
  prometheusSpec:
    additionalScrapeConfigs:
      - job_name: nfs-server
        static_configs:
          - targets: ['10.0.0.31:9100']
Then create the following additional rules; these are suggestions to verify in your own environment:
# disk full, filter the exact mountpoint, with a delay to avoid false alerts
100 * (1 - node_filesystem_avail_bytes{job="nfs-server",mountpoint="/export"}
        / node_filesystem_size_bytes{job="nfs-server",mountpoint="/export"}) > 80   # for: 10m

# sustained high CPU
100 - avg(rate(node_cpu_seconds_total{job="nfs-server",mode="idle"}[5m])) * 100 > 85   # for: 5m

# high iowait
avg(rate(node_cpu_seconds_total{job="nfs-server",mode="iowait"}[5m])) * 100 > 20   # for: 5m
In a Grafana-managed alert, remove the comparison (> 80...) from the query, set the threshold in the Threshold step and for in the Pending period; if you keep the operator in the query, set No data to OK, because an empty result is treated as missing data.
The alerts here are Grafana-managed alerts sent through a chat channel webhook, not Alertmanager. Do not rely on kubelet_volume_stats for static NFS PVs, as that has not been verified. A Loki log rule using count_over_time will fire repeatedly when an error repeats; set a pending period and group by labels as in Grafana Alerting for pods: RAM dashboards, alerts and the ingress-nginx ServiceMonitor.
The rpcbind port and firewall around a webroot on NFS
An NFS server that serves a webroot on NFS and has a public address will quickly get its port 111 (rpcbind) scanned. Log lines like "request from unauthorized host" show that the hosts.allow/hosts.deny rules or the firewall are blocking, which is good, not an error. Allow only the cluster's internal network range to reach ports 111 and 2049. With NFSv4, everything goes through port 2049, so there is no need to open a wide port range. For UID/GID when pods do not run as root, see NFS and non-root pods: UID/GID, root_squash and anonuid.
When to drop a webroot on NFS
- Put the code in the image to replace the webroot on NFS. The code sits on the node's local disk, fast and immutable; every deploy is a new image.
- Use NFS only for directories that are genuinely written to, such as uploads; do not put the whole
publicdirectory containingindex.phpon NFS. - Sessions and cache go to Redis; images and static files go to object storage (S3) behind a CDN, instead of shared files.
- Enable opcache with
validate_timestamps=0in production to reduce metadata round trips, and reload on deploy.
If you still need ReadWriteMany for a small directory, do not keep the whole webroot on NFS; keep NFS only for that directory and measure again after the change.
What is still unresolved
- The root cause of the webroot on NFS hangs: not confirmed; the NFS server CPU is only the strongest suspect.
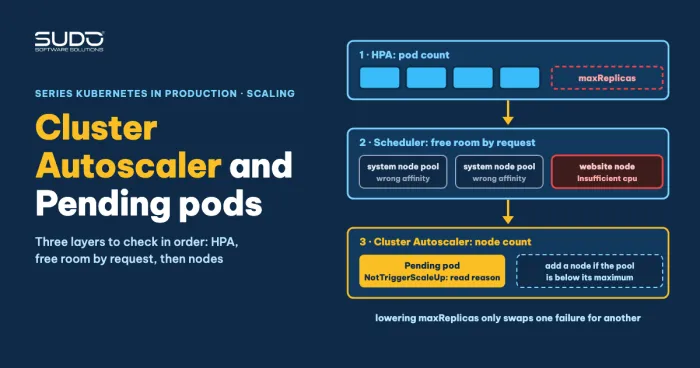
- Some other hangs may be caused by HPA hitting its cap or Pending pods lacking CPU (see Cluster Autoscaler on LKE: Pending pods, NotTriggerScaleUp and HPA at maxReplicas), which is noise to rule out before blaming the webroot on NFS.
Source documentation: the fio documentation and NFS volumes on kubernetes.io.
Next article
MySQL out of connections: 502s from Kubernetes pods with the root cause in the database. When NFS and storage are not the culprit, mass 502 errors may come from MySQL's connection ceiling.