If your cluster has Prometheus and Grafana but no per-pod alert rules, you usually learn that a pod is running out of RAM only when the site already returns 503. This guide closes that gap in three steps: write PromQL that reads the right pod metrics, build a dashboard that shows usage next to requests and limits, and turn the "RAM as a percentage of the limit" calculation into a Grafana Alerting rule, the alerting feature built into Grafana. The last section covers a common problem when monitoring ingress-nginx: Prometheus does not pick up the ServiceMonitor even though metrics are enabled.
This guide assumes the stack is already installed; Grafana Alerting is enabled by default in current Grafana releases. If it is not, read Kubernetes monitoring with kube-prometheus and Grafana first.
Why a dashboard needs usage next to requests and limits
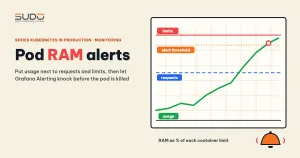
A RAM number on its own tells you nothing. Is a pod using 600Mi comfortable or about to die? The answer lies in two values declared in the manifest: requests (what the scheduler uses to place the pod) and limits (for RAM, a hard ceiling: exceed it and the container is OOM-killed; for CPU, exceeding it means throttling, not a kill). A useful RAM panel therefore has three lines: real usage, requests and limits, and the gap between usage and limits is your safety margin. How to choose these two values is covered in Requests and limits, QoS and nodeAffinity: placing pods on the right nodes.
PromQL for pod metrics and the range vector trap
Four query forms cover most dashboards:
- Filter by label:
kube_pod_info{namespace="site-a"} - Aggregate:
sum(metric), andsum by (pod) (metric)to split by pod - Take a time window:
metric[5m], called a range vector - Counter growth rate:
rate(metric[5m])orirate(metric[5m])
The trap is in the third form. metric[5m] returns a band of samples, and aggregation functions such as sum accept only instant vectors, so sum(metric[5m]) fails with a type error. A common "fix" is to add offset 5m, but offset does not change the data type: metric[5m] offset 5m is still a range vector, so sum still fails, while metric offset 5m is an instant vector but only the value from 5 minutes ago, not a statistic over the whole window. To aggregate over time, use the *_over_time functions:
sum by (pod) (
  avg_over_time(container_memory_working_set_bytes{container!="", image!=""}[5m])
)

# peak over 5 minutes
sum by (pod) (
  max_over_time(container_memory_working_set_bytes{container!="", image!=""}[5m])
)
On irate versus rate: irate follows every beat, which suits graphs; rate is smoother, which suits Grafana Alerting because a short spike does not trigger a false alarm.
The right metric sources for pods
Node exporter measures the machine (node); it has no per-pod or per-container metrics. For pods you need two sources:
- cAdvisor (through the kubelet, at
/metrics/cadvisor): real usage, such ascontainer_memory_working_set_bytesandcontainer_cpu_usage_seconds_total. - kube-state-metrics: values declared in the spec, such as
kube_pod_container_resource_requestsandkube_pod_container_resource_limits, with the labelresource="memory"or"cpu".
For RAM in dashboards and Grafana Alerting, choose working_set over usage_bytes: the working set is usage minus the inactive file cache; it is the number the kubelet uses for eviction and the closest indicator of OOM-kill risk. The container!="" condition drops the aggregate series for the whole pod.
Build a dashboard for one pod
In Grafana, create a new dashboard with two parts.
A pod selector variable
Go to Dashboard settings, Variables, and add a variable named pod of type Query, data source Prometheus, with the query label_values(kube_pod_info{namespace="site-a"}, pod). Every panel then uses $pod, and switching pods is just a matter of picking another one in the drop-down.
A three-query RAM panel and a CPU gauge
A Time series panel with three queries; set the legends to usage, requests and limits:
sum(container_memory_working_set_bytes{pod="$pod", container!="", image!=""})
sum(kube_pod_container_resource_requests{pod="$pod", resource="memory"})
sum(kube_pod_container_resource_limits{pod="$pod", resource="memory"})
The CPU gauge shows usage as a percentage of the limit. kube-prometheus-stack ships a recording rule for the usage part, but the rule name changes between chart versions (some end in sum_irate, others in sum_rate), so look it up in Explore before copying:
100 *
sum(node_namespace_pod_container:container_cpu_usage_seconds_total:sum_irate{namespace="site-a", pod="$pod"})
/
sum(kube_pod_container_resource_limits{namespace="site-a", pod="$pod", resource="cpu"})
From panel to alert rule in Grafana Alerting
A dashboard only helps when someone is looking at it, while Grafana Alerting knocks on the door by itself. The RAM-as-percentage-of-limit formula should be matched per container:
100 *
sum by (namespace, pod, container) (
  container_memory_working_set_bytes{container!="", image!=""}
)
/
sum by (namespace, pod, container) (
  kube_pod_container_resource_limits{resource="memory"}
)
Matching with by (namespace, pod, container) matters. A formula you often see takes the total working set and divides it by the max of the limits: it is correct only when the deployment has exactly one replica. With several replicas, the numerator adds up every pod while the denominator is the limit of a single pod, so the result shoots up and raises false alarms. Matching by labels compares each pod with its own limit, and each pod becomes a separate alert instance.
When you create the rule in Grafana Alerting (menu Alerting, Alert rules, New alert rule):
- Query A is the formula above. Add a Reduce (Last) expression if the query returns a time series, then a Threshold expression, for example "IS ABOVE 85", and set Threshold as the alert condition.
- Choose a folder and an evaluation group (the evaluation interval).
- Pending period: how long the condition must stay true before the rule moves to alerting, for example 5 minutes. If you leave it unset, a single evaluation that touches the threshold fires immediately.
- Add labels for routing, for example
severity=warning.
Each alert instance in Grafana Alerting moves through the states Normal, Pending and Alerting (commonly called firing), plus two states set by the system: NoData when the query returns no series at all, and Error when the query fails. Pay attention to the missing-limit case: a container that does not declare limits.memory has no series in the denominator, so it is dropped from the division result without any notice. NoData happens only when the whole query is empty, meaning no container in the filter scope has a limit. A container without a limit therefore slips out of the rule silently: no alert instance and no NoData. Add a separate Grafana Alerting rule or panel to count them:
count by (namespace, pod, container) (
  container_memory_working_set_bytes{container!="", image!=""}
)
unless on (namespace, pod, container)
kube_pod_container_resource_limits{resource="memory"}
A non-empty result means some containers still have no limit declared.
Contact points and notification policies in Grafana Alerting
A rule only decides when to alert. In Grafana Alerting, two other things decide where the alert goes:
- Contact point: the destination, for example a webhook to a chat tool. Use the Test button to send a sample notification.
- Notification policy: a routing tree based on labels. Add a nested policy with the matcher
severity = warningand remember to choose the contact point inside that policy itself. If you skip this step, the alert falls back to the root policy and may not reach the right channel.
To test, lower the threshold (for example to 20) until the message arrives, then set the real threshold back. An alert created in Grafana Alerting is a Grafana-managed alert and, by default, does not go through the Alertmanager of kube-prometheus-stack (unless you configure Grafana to forward to an external Alertmanager). The two systems have separate routing trees, so do not configure one and wait for results from the other. Official documentation: Grafana Alerting documentation.
The ingress-nginx ServiceMonitor
To get a dashboard and Grafana Alerting for ingress-nginx, enable metrics in the chart values:
controller:
  metrics:
    enabled: true
    serviceMonitor:
      enabled: true
      additionalLabels:
        release: kube-prometheus-stack
After adding the repo with helm repo add ingress-nginx <official-repo-url> (the URL is in the ingress-nginx documentation), install with helm upgrade --install ingress-nginx ingress-nginx/ingress-nginx -n ingress-nginx --create-namespace -f values.yaml.
Then open Prometheus, go to Status, Targets, and look for the ingress-nginx target. If it is missing, here is the mechanism. Prometheus Operator picks up only ServiceMonitor objects that match serviceMonitorSelector. With the default kube-prometheus-stack, the selector is the release label matching the stack's release name. The namespace selector is left empty, which means Prometheus looks at every namespace, so ingress-nginx living in a different namespace is not what blocks it. The label is.
ingress-nginx metrics are also a source for Grafana Alerting, for example an alert on the 5xx ratio. There are two ways to handle a target that does not appear:
- Add a matching label as in the example above (set
additionalLabels.releaseto the correct release name). It is strict, but you must remember it for every ServiceMonitor. - Set two flags,
prometheus.prometheusSpec.serviceMonitorSelectorNilUsesHelmValues=falseandprometheus.prometheusSpec.podMonitorSelectorNilUsesHelmValues=false. Prometheus then picks up every ServiceMonitor and PodMonitor in the cluster. It is convenient, but you lose the boundary: anyone who can create a ServiceMonitor can put a target into Prometheus.
These two flags belong to the stack chart's values and need a helm upgrade with the full values. Once the target is UP, you can import a community dashboard from grafana.com by ID; if panels are empty, check the real metric names in Explore. Do not edit a Helm-managed Service with kubectl apply: the next helm upgrade overwrites it.
Common mistakes
- Wrong results with several replicas: the numerator adds up several pods while the denominator is one limit. Match on
(namespace, pod, container). - Containers without a limit are silently skipped by the rule: use the
unless onquery above to list them, then declare a limit; NoData fires only when the whole query is empty. - Pod names change after every rollout: a panel or Grafana Alerting rule that hard-codes a pod name goes empty. Use a variable, or filter by
namespaceandcontainer. - Dashboards lost after a monitoring chart
helm upgrade: in some cases Grafana restarts with a new PVC and the old dashboards disappear. The cause has not been confirmed. Hypotheses to check: the values do not enable persistence, or--reuse-valueswas not used so the configuration went back to defaults. To check:kubectl get pvc -n monitoringandkubectl describe podfor Grafana, and see which volume is mounted. The reliable safeguard is to export dashboards as JSON and keep them in Git, or load them through provisioning.
Checklist for Grafana Alerting on pods
- A one-pod dashboard has a
podvariable and three lines: usage, requests and limits. - The RAM rule in Grafana Alerting matches on
(namespace, pod, container)and has a pending period. - The Grafana Alerting contact point has been tested; the policy selects the contact point and matches the labels.
- Test Grafana Alerting with a low threshold, then set the real threshold back.
- Every container declares
limits; otherwise the rule skips that container without notice; use theunless onquery to detect them. - The ingress-nginx ServiceMonitor appears in Targets; dashboards are backed up as JSON.
Next article
MySQL temporary tables filling the disk: error 1114 and innodb_temp in a Kubernetes pod. When the volume capacity alert fires, the next question is what is eating the disk inside the MySQL pod.