You install mysqld_exporter with Helm and the pod reports 1/1 Running, but Prometheus either shows no target, or shows a green target while the graphs stay empty. None of the three errors below prints a warning at install time, so it is easy to lose hours tracking them down. This article follows the data path layer by layer so you can tell where the fault is: does Prometheus have a target, can mysqld_exporter talk to MySQL, and did Helm actually accept the values you passed?
If your cluster does not have Prometheus yet, set it up first with Kubernetes monitoring with kube-prometheus and Grafana. This article assumes that stack is already running in a namespace called monitoring.
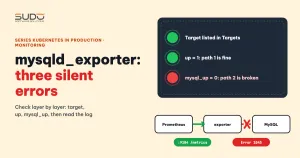
Architecture: mysqld_exporter bridges two separate paths
Prometheus does not speak the MySQL protocol. mysqld_exporter is a small process in the middle: it opens a connection to MySQL, runs statements such as SHOW GLOBAL STATUS, and returns the result as plain text on port 9104, path /metrics. Keep the two paths clearly apart:
- Path 1: Prometheus sends HTTP requests to
mysqld_exporter(through a Service, port 9104). - Path 2:
mysqld_exporterlogs in to MySQL with the user and password you configured.
If path 1 is broken, Prometheus has no target or the target is down. If path 2 is broken, the target stays up, because the exporter still serves /metrics normally; it just reports mysql_up 0 and no MySQL data. These two situations look very different from Prometheus, and that difference is the key to diagnosis.
Create a monitoring user with minimal privileges
mysqld_exporter only needs read access. The project documentation recommends the PROCESS, REPLICATION CLIENT and SELECT privileges, plus a cap on concurrent connections:
CREATE USER 'exporter'@'10.0.0.%' IDENTIFIED BY '<password>'
  WITH MAX_USER_CONNECTIONS 3;
GRANT PROCESS, REPLICATION CLIENT, SELECT ON *.* TO 'exporter'@'10.0.0.%';
Two points deserve thought. First, the host '%' allows logins from anywhere; limit it to the pod network range if your cluster network allows it. Second, SELECT ON *.* is a broad privilege. Some collectors need it, but if you disable the collectors that read tables, you can narrow it down. Verify in a test environment before removing a privilege.
Install the prometheus-mysql-exporter chart
The chart is maintained by the Prometheus community. Here is a sample install command with neutral names:
helm repo add prometheus-community https://prometheus-community.github.io/helm-charts
helm repo update

helm install db1-exporter prometheus-community/prometheus-mysql-exporter \
  -n monitoring \
  --set mysql.user=exporter \
  --set mysql.pass='<password>' \
  --set mysql.host=db-1.db.svc.cluster.local \
  --set mysql.port=3306
After installing mysqld_exporter, check the pod, the Service and the log, in that order:
kubectl -n monitoring get pods,svc
kubectl -n monitoring logs deploy/db1-exporter-prometheus-mysql-exporter
The startup log lists the collectors that are enabled (global_status, global_variables, slave_status...) and a Listening on ... :9104 line. One detail is easy to miss: mysqld_exporter usually opens its connection to MySQL when a scrape arrives, not at startup. So a clean log right after the pod comes up proves nothing. Login errors only appear after Prometheus makes its first request.
Error 1: a relabel keep rule drops every pod and creates no target
The initial scrape configuration used kubernetes_sd_configs with role: pod and two keep rules, one on the pod label prometheus=true and one on the annotation prometheus.io/scrape=true:
# lives under prometheus.prometheusSpec in the kube-prometheus-stack values,
# then run helm upgrade for the stack
additionalScrapeConfigs:
  - job_name: 'mysql-exporter'
    kubernetes_sd_configs:
      - role: pod
    relabel_configs:
      - source_labels: [__meta_kubernetes_pod_label_prometheus]
        action: keep
        regex: "true"
      - source_labels: [__meta_kubernetes_pod_annotation_prometheus_io_scrape]
        action: keep
        regex: "true"
The chart's pod has neither that label nor that annotation. A keep rule retains only matching targets, so every pod is dropped and the Status → Targets page shows no row for this job. No error is reported, because "no match" is a valid result. You have three ways to fix it:
- Add the label or annotation to the pod (through
podLabelsorpodAnnotationsin the chart values, if your chart version has them). - Drop service discovery and use
static_configspointing straight at the Service (the simplest option, shown below). - Use a Prometheus Operator ServiceMonitor. This is an extra beyond the original case: enable
serviceMonitor.enabledin the chart values and set thereleaselabel inserviceMonitor.additionalLabelsso it matches the selector Prometheus uses (checkvalues.yamlfor your exact chart version).
Remember that an annotation such as prometheus.io/scrape is not a Prometheus standard. It only has an effect when your own relabel rule reads it. The __meta_kubernetes_* keys are described in the Prometheus kubernetes_sd_config documentation.
Error 2: mysqld_exporter is up but has no data because of Access denied
After switching to static_configs, the target shows up, but queries for MySQL metrics are still empty:
# also under prometheus.prometheusSpec, then helm upgrade the stack
additionalScrapeConfigs:
  - job_name: 'mysql-exporter'
    static_configs:
      - targets: ['db1-exporter-prometheus-mysql-exporter:9104']
Take the Service name from kubectl -n monitoring get svc. If Prometheus runs in a different namespace, use the full name with the .monitoring.svc suffix. This is where the two paths separate: a target that is up means path 1 is fine. To inspect path 2, ask mysqld_exporter directly:
# port-forward runs in the foreground: background it with &, or open a second terminal for curl
kubectl -n monitoring port-forward svc/db1-exporter-prometheus-mysql-exporter 9104:9104 &
sleep 2
curl -s localhost:9104/metrics | grep '^mysql_up'
# mysql_up 0  => the exporter cannot log in to MySQL
In Prometheus, querying mysql_up gives the same answer. Only now do you read the mysqld_exporter log. A typical line when the credentials are wrong:
level=ERROR msg="Error opening connection to database"
err="Error 1045 (28000): Access denied for user 'exporter'@'10.0.0.x' (using password: YES)"
Note using password: YES: mysqld_exporter does send a password, just not the one you think. The next step is to ask why.
Error 3: Helm silently accepts a key that does not exist
The original install command used --set mysql.password=.... The chart's real key is mysql.pass. Helm does not complain, because --set only merges the value into the values tree, while the templates read only the keys they know. Unknown keys are ignored, and mysql.pass keeps the chart's default value (not the user's real password). So mysqld_exporter still logs in "with a password" and MySQL rejects it.
Switch to the correct key and upgrade the release, and the error goes away and the data appears:
helm upgrade db1-exporter prometheus-community/prometheus-mysql-exporter \
  -n monitoring --reuse-values \
  --set mysql.pass='<password>'
The same original command also had mysql.metrics.tls=false. We have not confirmed that this key has any effect: it is quite possibly another unknown key, depending on the chart version. Treat that as a hypothesis and check it yourself with helm show values for the exact chart version you use. Do not copy keys from an article, this one included.
Catch values errors early, before they cost you time
The following three steps catch all three errors early:
# 1. Valid keys for the exact chart version
helm show values prometheus-community/prometheus-mysql-exporter | grep -n -A12 '^mysql:'

# 2. Values the user passed (an unknown key still shows up here, with no error)
helm get values db1-exporter -n monitoring

# 3. Check that the rendered manifest contains the values you expect
helm template db1-exporter prometheus-community/prometheus-mysql-exporter \
  --set mysql.pass='<password>' | grep -n -i -E 'pass|user|host'
If helm get values lists a key that helm show values does not have, you have made a typo. If a chart has no values.schema.json, Helm checks nothing; a chart with a schema only blocks unknown keys when the schema forbids extra properties (additionalProperties: false), so do not rely on Helm to catch typos. Command details are in the helm get values documentation. The final check is always mysql_up equal to 1, not a clean log.
Three notes on using these commands. First, the password in a Secret generated by the chart is base64-encoded, so grep pass on the manifest only shows an encoded string and does not prove the value is correct; decode it with kubectl -n monitoring get secret <secret-name> -o jsonpath='{.data}' and then base64 -d the value you want to inspect. Second, helm get values and helm template print the password in clear text to the terminal, so do not run them while sharing your screen or recording logs. Third, helm upgrade --reuse-values keeps the old wrong key in the release values as well; to clean up, use --reset-values and pass all the required values again.
Grafana dashboard and a SHOW PROCESSLIST panel
The community dashboard with ID 14057 (type MySQL) can be imported straight into Grafana from the grafana.com dashboards page to display mysqld_exporter metrics. We have not checked which panels of that dashboard render correctly with the exporter version you install, so try it and delete the empty panels.
To see the list of running processes, add a MySQL data source in Grafana, create a table panel and enter the query SHOW PROCESSLIST. Use a separate user for Grafana, not the one shared with mysqld_exporter:
CREATE USER 'grafana'@'10.0.0.%' IDENTIFIED BY '<password>'
  WITH MAX_USER_CONNECTIONS 5;
GRANT PROCESS ON *.* TO 'grafana'@'10.0.0.%';
Only PROCESS is needed to see every user's processes. You do not need SELECT ON *.* just to display the process list. Remember that the Info column contains the verbatim query text, which may include sensitive data, so grant access to this dashboard only to people who need it.
mysqld_exporter installation checklist
- A dedicated user for
mysqld_exporter, minimal privileges, withMAX_USER_CONNECTIONS, and a host limited to the pod range. - Run
helm show valuesbefore typing--set, andhelm get valuesafter installing. - Work through the layers when data is missing: is there a target, is
upequal to 1, ismysql_upequal to 1, and only then read the log. - Read the
mysqld_exporterlog after a scrape, not right at startup. - Do not paste the password into a
--setcommand in a shared script. Use an existing Secret if the chart supports it. - Keep the Grafana user separate from the
mysqld_exporteruser.
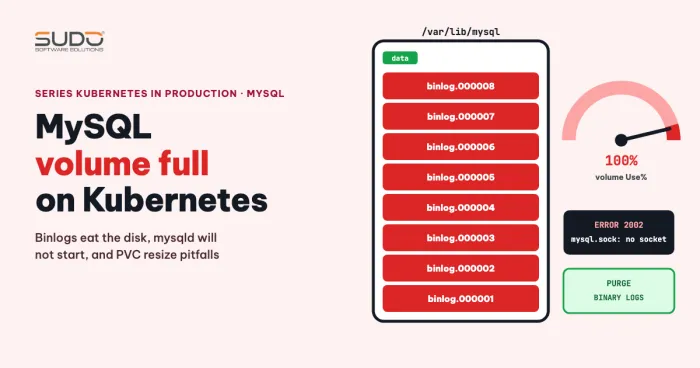
mysqld_exporter tells you what MySQL is doing (connections, queries, replication), while volume capacity has to be tracked with the kubelet's kubelet_volume_stats_* metrics. For binlogs, the binlog_size collector is not enabled by default. When a MySQL volume fills up, read MySQL volume full on Kubernetes: binlogs, rebuilding the PVC and resize pitfalls.
Next article
Health endpoint for Laravel on Kubernetes: what to check and which probe to use. Each probe answers exactly one question, and a health endpoint should check only what it needs to, so one outside dependency does not take the whole website down with it.