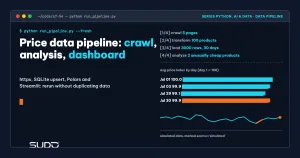
A good data pipeline is not one long script that happens to run once. It is a chain of small steps, each with its own input, output and check, that gives the same result no matter how many times you rerun it. This article builds a complete data pipeline for product prices: collect HTML with httpx, clean it with BeautifulSoup and pandas, load it into SQLite idempotently, analyze it with Polars and show it on a Streamlit dashboard. It ends with automated tests for the dashboard and a list of the mistakes that show up when a data pipeline starts running on a schedule.
The article stitches together pieces written separately in this series: crawling with requests and BeautifulSoup, a polite and compliant crawler, cleaning crawled data with pandas and Polars for large datasets. All numbers are real output from an Apple M4 with 16 GB, Python 3.12 (package versions are in requirements.txt), and the source is in code/s7-54. The only real data is the 100 books of a practice site; the price history is simulated and clearly marked as such in the database.
The problem: a product price data pipeline
A store wants to track the prices of 100 products every day to answer three questions: is the overall price level going up or down, which products are unusually cheap compared with their own history, and are they in stock. For a retailer this is competitor or supplier price monitoring; here we use books.toscrape.com, a site Zyte built specifically for learning to crawl, so the example is repeatable and does not touch anyone's real site.
The most important idea in a data pipeline is to split the problem into layers with clear boundaries, because those boundaries are what make bugs quick to fix:
| Layer | What it does | Where it is stored | Why it is separate |
|---|---|---|---|
| 1. Collect | Download HTML, interpret nothing | data/raw/<day>/page-N.html | Keeps the original; if the parser is wrong, rerun from the files instead of downloading again |
| 2. Transform | Parse, clean, check quality | In-memory DataFrame | Bad data is blocked before it reaches the database |
| 3. Load | Write to SQLite with an upsert | data/prices.db | Rerunning does not duplicate rows |
| 4. Analyze | Compute metrics with SQL and Polars | Polars DataFrame | Calculation logic is separate from the UI |
| 5. Display | Streamlit reads the database and draws charts | Browser | The UI is read-only and never writes to the database |
Each file in the data pipeline does one job: config.py, crawl.py, transform.py, load.py, analyze.py, app.py, and run_pipeline.py to chain the steps together.
Layer 1: polite collection and keeping the raw copy
The first rule of the collection layer in a data pipeline is to interpret nothing. We download the HTML and write it to disk verbatim, in a per-day folder. If the parser misreads the rating, we fix the parser and reprocess the saved pages without calling the server again. This layer is immutable: append only, never edit.
def fetch(client: httpx.Client, url: str, retries: int = 3) -> str:
    for attempt in range(1, retries + 1):
        try:
            r = client.get(url)
            r.raise_for_status()
            return r.text
        except httpx.HTTPError as exc:
            wait = 2 ** attempt
            print(f"  error {exc!r} (attempt {attempt}/{retries}), waiting {wait}s", file=sys.stderr)
            time.sleep(wait)
    raise RuntimeError(f"could not download {url}")
Three details are worth noting. First, timeout=15 is set explicitly: according to the HTTPX documentation, the default is 5 seconds without data, and there are four different kinds of timeout (connect, read, write, pool), so a long-running crawler should choose a value on purpose instead of accepting the default. Second, retries wait twice as long each time (2, 4, 8 seconds) so we do not hammer the server. Third, raise_for_status() turns a 404 or 500 into an exception; without that line, an error page would be saved as if it were valid data and break silently in a later layer.
On compliance: we set a User-Agent that states a name and purpose, pause 1 second between requests (DELAY_S = 1.0) and download only 5 pages. books.toscrape.com has no robots.txt (the server returned 404 when we checked) and was built for crawling practice, so it is a safe example. For a real site, read robots.txt and the terms of service, respect rate limits and avoid collecting personal data; the details are in a polite and compliant crawler. If you need to crawl thousands of pages with a queue and retries, move to Scrapy; the loop above only suits a few dozen pages.
Layer 2: transform and check quality
The parse_page function reads each article.product_pod element and extracts the key, title, price string, rating and stock status. The natural key is the slug taken from the URL path (for example a-light-in-the-attic_1000), because a book title can change while the path is far more stable. A correct key is the foundation of the upsert in the next layer.
The price on the page is the string £51.77. If the page is decoded with the wrong character set, that character becomes £, a classic crawling bug. Instead of handling each case separately, we strip every character that is not a digit or a dot with a regular expression and cast to float; this survives both forms. More detailed cleaning (deduplication, data types, missing values) is covered in cleaning crawled data with pandas.
df["price"] = df["price_text"].str.replace(r"[^0-9.]", "", regex=True).astype(float)
df = df.drop(columns="price_text").drop_duplicates("slug", keep="last")
The most important part of the transform layer in a data pipeline is the validate function: it returns a list of errors, and an empty list means the data passes. We check that the table is not empty, prices are present and positive, ratings are between 1 and 5, and keys are unique. If there are errors, the data pipeline stops with an exception before touching the database. The principle is "fail loudly": silently wrong data in the database is far worse than a failed run with a clear message.
For example, when the site changes its layout, the CSS selector no longer matches and parse_page returns 0 rows; without validate, we would write a day of empty data and nobody would know. That is why clean always returns a table with all columns, even with no rows, so that validate reports "no rows" instead of a confusing KeyError.
Layer 3: loading into SQLite idempotently
Idempotent means running twice gives the same result as running once. This is a required property of every data pipeline that runs on a schedule, because every job eventually gets rerun after a network failure, an accidental click or a catch-up run. The schema uses a composite primary key (slug, day), so each product has exactly one price per day:
CREATE TABLE IF NOT EXISTS price_history (
    slug TEXT NOT NULL REFERENCES products(slug),
    day TEXT NOT NULL,
    price REAL NOT NULL CHECK (price > 0),
    in_stock INTEGER NOT NULL,
    source TEXT NOT NULL,              -- 'crawl' or 'simulated'
    PRIMARY KEY (slug, day)
);
The write step of the data pipeline uses INSERT ... ON CONFLICT DO UPDATE. According to the SQLite documentation, the upsert syntax arrived in version 3.24.0 (2018), modeled on PostgreSQL; the excluded. prefix refers to the value the INSERT was about to write. One thing to remember: only a uniqueness constraint (primary key, UNIQUE) triggers the upsert, while a violated CHECK or NOT NULL still raises an error and the statement is aborted.
with con:  # one transaction: write everything or nothing
    con.executemany(
        "INSERT INTO price_history(slug, day, price, in_stock, source) VALUES (?,?,?,?,?) "
        "ON CONFLICT(slug, day) DO UPDATE SET price=excluded.price, "
        "in_stock=excluded.in_stock, source=excluded.source",
        [(r.slug, day, float(r.price), int(r.in_stock), source) for r in df.itertuples()])
In this data pipeline, the with con: block wraps the whole batch in one transaction, so if row 80 violates CHECK (price > 0), the 79 rows before it are rolled back too. SQLite fits when the data pipeline runs on one machine and the dashboard is read-only; when several processes write at once or the data grows to tens of GB, move to PostgreSQL with the same upsert syntax, and the rest of the code stays almost unchanged.
Running the whole data pipeline and reading the real output
The run_pipeline.py script chains the first four steps of the data pipeline. Because the practice site does not change prices from day to day, we use the real prices from the crawl as the baseline (the day label is set by hand to 2026-07-01 so results are reproducible), then generate 29 days of simulated price history with a fixed seed: prices fluctuate about 2% around the baseline, and 15% of products get a 10 to 30% discount lasting 3 to 6 days. Every simulated row carries source = 'simulated' so nobody mistakes it for real data.
$ python run_pipeline.py --fresh
[1/4] crawl
  saved raw/2026-07-01/page-1.html (50,449 bytes)
  saved raw/2026-07-01/page-2.html (50,853 bytes)
  saved raw/2026-07-01/page-3.html (51,354 bytes)
  saved raw/2026-07-01/page-4.html (52,504 bytes)
  saved raw/2026-07-01/page-5.html (51,809 bytes)
[2/4] transform
  100 products, price 10.16-58.11 GBP, avg rating 2.93
[3/4] load
  price_history: 3000 rows, 100 products, 30 days
[4/4] analyze
shape: (2, 4)
┌─────────────────────────────────┬────────┬────────┬───────────────┐
│ title                           ┆ median ┆ latest ┆ vs_median_pct │
│ ---                             ┆ ---    ┆ ---    ┆ ---           │
│ str                             ┆ f64    ┆ f64    ┆ f64           │
╞═════════════════════════════════╪════════╪════════╪═══════════════╡
│ Throwing Rocks at the Google B… ┆ 31.225 ┆ 22.2   ┆ -28.9         │
│ My Paris Kitchen: Recipes and … ┆ 33.35  ┆ 25.84  ┆ -22.5         │
└─────────────────────────────────┴────────┴────────┴───────────────┘
total time: 9.5s
Reading the result of the data pipeline: 5 pages for 100 products, a full 3,000 rows (100 products times 30 days), of which 100 rows have source crawl and 2,900 are simulated. Most of the 9.5 seconds comes from our deliberate 1-second pause between pages. Only 2 products are currently at least 10% cheaper than their own historical median: they are the two products whose simulated discount is still running on the last day.
Layer 4: analysis with SQL and Polars
The analysis layer of the data pipeline reads from the database with one SQL JOIN, then computes metrics with Polars. With 3,000 rows pandas would be fast enough too; we pick Polars because its expression syntax reads well for grouping and the data will keep growing (the two libraries are compared in Polars for large datasets). The key metric is how far the latest price sits from the historical median, because the median is less skewed by the discounts themselves than the mean is.
def price_stats(df: pl.DataFrame) -> pl.DataFrame:
    return (df.sort("day").group_by("slug", maintain_order=True)
              .agg(pl.first("title"), pl.first("rating"),
                   pl.col("price").min().alias("min"),
                   pl.col("price").median().alias("median"),
                   pl.col("price").last().alias("latest"))
              .with_columns(((pl.col("latest") / pl.col("median") - 1) * 100)
                            .round(1).alias("vs_median_pct")))
Calling sort("day") before group_by is mandatory: last() only means "latest price" when the data is ordered by day. Drop the sort and the result still contains numbers, but they are wrong, with no warning. The daily_index function normalizes the daily average price to 100 on the first day, so a single line shows whether the overall price level is rising or falling:
def daily_index(df: pl.DataFrame) -> pl.DataFrame:
    """Average price index by day (first day = 100)."""
    d = df.group_by("day").agg(pl.col("price").mean().alias("avg")).sort("day")
    return d.with_columns((pl.col("avg") / pl.col("avg").first() * 100).round(2).alias("index"))
The price index on the last day (2026-07-30) is 99.94 and on 2026-07-29 it is 99.09: the overall level is almost flat, as expected, because the simulation only adds noise and local discounts.
Layer 5: the Streamlit dashboard
At the end of the data pipeline, Streamlit reruns the whole script every time the user touches a widget. If every run reads the database and recomputes everything, the page becomes slow. The fix is caching: according to the Streamlit caching documentation, st.cache_data is for serializable data such as DataFrames and returns a copy on each call, while st.cache_resource is for shared resources such as database connections or models. The ttl parameter sets the cache lifetime so the data does not stay stale forever.
@st.cache_data(ttl=600)   # reread the database after 10 minutes
def load() -> pl.DataFrame:
    return analyze.history()

if st.sidebar.button("Reload data"):
    st.cache_data.clear()

h = load()
if h.is_empty():
    st.warning("No data yet. Run run_pipeline.py first.")
    st.stop()
Three sidebar widgets (minimum rating, the "cheaper than median" threshold, "in stock only") filter the DataFrame before the metrics are computed, so the number cards and charts always match the filters. The body has three number cards, the price index chart, a table of cheap products and the price history of the selected product. A footnote says plainly that the history after the first day is simulated data. Run it with streamlit run app.py; during checking, the server started in headless mode and the health endpoint /_stcore/health returned HTTP 200 with the body ok (the command and output are saved in health_output.txt).
Streamlit suits the dashboard of an internal data pipeline and quick prototypes; when you need fine-grained permissions for external customers, use a web application with its own API.
Testing the data pipeline
The dashboard at the end of the data pipeline can still break. Streamlit ships an AppTest testing framework that runs the app without a browser: AppTest.from_file("app.py").run(), then read elements such as at.metric, at.dataframe or at.exception, and simulate interaction such as at.slider[1].set_value(25).run(). The test_pipeline.py file checks five things: page 1 parses into exactly 20 valid rows, loading twice does not change the row count, a negative price and an empty page are caught by validate, and the dashboard runs without an exception.
$ /usr/bin/time -l python test_pipeline.py
idempotent: 3000 rows before, 3000 rows after loading again 2 times
error caught: ['price missing or not positive']
empty page -> ['no rows']
dashboard OK: [('Products', '100'), ('On sale', '2'), ('Price index today', '99.9')]
discount table rows: 2
25% threshold -> metric: [('Products', '100'), ('On sale', '1'), ('Price index today', '99.9')]
The last line shows the test really interacts with the UI: raising the threshold from 10% to 25% drops the number of discounted products from 2 to 1, matching the table above (28.9% and 22.5%). The "empty page" line shows that a changed HTML layout is stopped by validate with a clear message. On the test machine the suite ran in a few seconds with peak RAM around 200 MB (the maximum resident set size line), light enough to put into CI on every push (for setting up CI, see automated deployment with GitLab Runner).
Running the data pipeline on a schedule
A data pipeline is only worth something when it runs by itself. On a Linux server, one cron line each morning is enough at this scale; when several jobs depend on each other and you need to see run history, use an orchestrator such as Jenkins or Airflow. Whichever tool you choose, the data pipeline should come with three things:
- An explicit date parameter:
crawl.py --as-of 2026-07-01lets you backfill a missed day. - A non-zero exit code on failure: an exception in
validatemakes the process exit with an error code so the orchestrator turns red and sends an alert. - A freshness measure: the dashboard should show the date of the latest data; a pretty dashboard that is three days stale is more dangerous than a broken one.
When not to build a data pipeline like this
- There is an official API or a data feed: a data pipeline that reads an API is far more stable than one that parses HTML, which breaks whenever the site changes its layout.
- Many writers at the same time: SQLite locks writes; move to PostgreSQL.
- The site forbids crawling or holds personal data: stop and ask legal first.
Common mistakes
- Treating simulated data as real data: always keep a
sourcecolumn and a footnote on the dashboard. - Writing with a plain
INSERT: a rerun causes duplicate-key errors or duplicated rows. - Forgetting to sort before taking
last(): the result is wrong with no error. - A cache without a
ttl: the dashboard shows old data forever.
Checklist
- Layer the data pipeline clearly: immutable raw files, a clean table with checks, analysis separate from the UI.
- Crawl politely in the data pipeline: a clear User-Agent, pauses between requests, a timeout, growing retry delays, and read robots.txt and the terms of service.
- Load idempotently in the data pipeline: a natural primary key, upsert, transaction; prove it by running twice.
- Give the dashboard a cache with a ttl, show the source and the data date, and cover it with an AppTest test.
Setup: python3.12 -m venv .venv && .venv/bin/pip install -r requirements.txt, then run run_pipeline.py --fresh, test_pipeline.py and streamlit run app.py in code/s7-54. The files run_pipeline_output.txt and test_output.txt hold the output pasted above.
Next article
End-to-end AI project: a customer support RAG chatbot, evaluation and deployment. This article assembled data into a complete data pipeline; the next one does the same for generative AI, from preparing documents and retrieval to evaluating answer quality and deployment.