You apply a Deployment, kubectl get pod reports Pod Pending, and kubectl describe pod shows a FailedScheduling event with 0/3 nodes are available: 3 Insufficient cpu. If the node CPU chart looks idle, you are looking at two different measures: the scheduler adds up requests, it does not measure usage. This guide shows how to calculate free CPU by hand from kubectl describe node, explains why the scheduler leaves a Pod Pending even when real usage may be low, and how to read two misleading messages correctly: "No preemption victims found" and NotTriggerScaleUp. The Pod Pending examples are based on a Linode LKE cluster, but the numbers are only illustrative; the calculation applies to any Kubernetes cluster.
If you want to know why the system moved to Kubernetes in the first place, see Website AI on VPS: why we started planning a move to Kubernetes. This article focuses only on the free-capacity calculation.
Symptoms of a Pod Pending caused by Insufficient cpu
A Pod Pending sits in the Pending state with an empty NODE column. The Events section of kubectl describe pod usually contains three kinds of lines (the FailedScheduling event may repeat many times):
Warning  FailedScheduling   default-scheduler   0/3 nodes are available: 3 Insufficient cpu.
         preemption: 0/3 nodes are available: 3 No preemption victims found for incoming pod.
Normal   NotTriggerScaleUp  cluster-autoscaler  pod didn't trigger scale-up: ...
When a Pod Pending shows up, the first line says all three nodes were rejected because there is not enough CPU to reserve. The word "reserve" is the key. The scheduler does not look at current CPU usage; it only adds up the declared requests. If the CPU graph is low and the pod is still Pending, those are two different measures.
Reading describe node to diagnose Pod Pending: Capacity, Allocatable and Allocated
Run kubectl describe node <node-name> and look for four blocks. A shortened example for a 1 vCPU node:
Capacity:
  cpu:     1
Allocatable:
  cpu:     1
Non-terminated Pods:
  Namespace    Name                CPU Requests  CPU Limits
  default      ingress-controller  100m (10%)    0 (0%)
  default      app-queue           500m (50%)    500m (50%)
  kube-system  calico-node         250m (25%)    0 (0%)
Allocated resources:
cpu 850m (85%) 500m (50%)- Capacity is the total resources of the machine. Allocatable is the part available to pods, after subtracting what Kubernetes and the operating system reserve (kube-reserved, system-reserved). If the provider does not reserve CPU, Allocatable equals Capacity, as in the example; memory usually has an Allocatable smaller than Capacity. The scheduler uses Allocatable. See the reserve compute resources documentation.
- Non-terminated Pods lists every pod that occupies space, including system pods such as the CNI, DNS and kube-proxy.
- Allocated resources is the sum of the Requests and Limits columns. The percentage here is relative to Allocatable, and the Requests column is the one the scheduler cares about. It is not the CPU that is actually running.
The numbers above are only illustrative; run the command on your own cluster. Capture describe node before you change anything, because after you add a node or lower a request it no longer reflects the moment the pod was Pending.
Calculating free capacity per node when a Pod is Pending
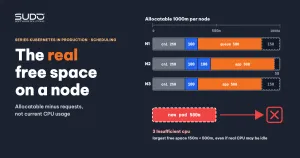
The formula is simple: free = Allocatable - sum of CPU Requests of all Non-terminated pods. Take three 1 vCPU nodes, each running calico-node with a 250m request:
| Node | Pods occupying it | Total request | Free |
|---|---|---|---|
| node-1 | calico 250m, ingress 100m, app-queue 500m | 850m | 150m |
| node-2 | calico 250m, coredns 100m x 2, app 500m | 950m | 50m |
| node-3 | calico 250m, coredns 100m, app 500m | 850m | 150m |
The Pod Pending asks for 500m. No node has 500m free, so all three are rejected and you get exactly the 3 Insufficient cpu line. Real usage may be far below the request percentage and the Pod Pending still cannot be scheduled, because a request is what was promised, not what is being used. Cross-check with kubectl top node (requires metrics-server).
The free space of the three nodes totals 350m, but it cannot be added up, because a pod must fit entirely on one node. Memory is calculated the same way as CPU, and the scheduler also checks the maximum pod count, taints, affinity and other constraints, so "Insufficient cpu" is only one of the possible reasons.
Request equals limit: an often-missed cause of Pod Pending
One detail that easily causes a Pod Pending: if a container declares only limits and no requests, Kubernetes sets the request equal to the limit. The manifest below looks like "just a 500m cap" but actually reserves 500m:
resources:
  limits:
    cpu: "500m"
    memory: "512Mi"
# result: requests.cpu = 500m, requests.memory = 512Mi, QoS = Guaranteed
When both CPU and RAM have requests equal to limits, the pod belongs to the Guaranteed QoS class. A practical consequence: lowering the limit of another workload (for example a queue worker from 500m to 100m) frees 400m of request, and the Pod Pending can get in. This holds only if that workload declared limits alone; if it already has its own requests, you must lower the requests to free the space. A LimitRange can also set a different default request. Here is an explicit way to declare resources that avoids relying on implicit rules:
resources:
  requests:
    cpu: "100m"
    memory: "256Mi"
  limits:
    cpu: "500m"
    memory: "512Mi"
Even if scheduling succeeds, make sure the workload you lowered still has enough real CPU; measure with kubectl top pod before lowering.
What "No preemption victims found" means for a Pod Pending
When a Pod Pending cannot fit on any node, the scheduler tries preemption: evicting lower-priority pods to make room. The message "No preemption victims found for incoming pod" means no pod qualifies for eviction. Preemption only evicts pods with a lower priority than the new pod. The new pod usually has priority 0, other application pods are also 0, and system pods such as the CNI or DNS have even higher priority (system-cluster-critical, system-node-critical), so there is no valid victim. Preemption also does not help if evicting still leaves too little room. This is normal behavior, not a separate error; if you want a hierarchy, declare a PriorityClass for important workloads. See pod priority and preemption.
NotTriggerScaleUp: why a Pod Pending does not make the cluster add nodes
The NotTriggerScaleUp line comes from the cluster-autoscaler: it examined the pod and decided not to add a node. The message is sometimes cut off at "pod didn't trigger scale-up:" without giving a reason. In that case there is no conclusion yet; the items below are only hypotheses you must verify yourself:
- The node pool does not have autoscaling enabled, or it has reached the pool's maximum node count.
- The pod asks for more than the Allocatable of the node type in the pool, so adding a node of the same type would not fit it either. For example, an 800m request never fits a 1 vCPU node, because 1000m minus 250m for the CNI leaves only 750m.
- The pod has constraints (nodeSelector, affinity, zone-bound volumes) that make a new node unsuitable.
To check, read carefully the part after the colon in the event (it usually lists reasons per node group) and look at the node pool's autoscaler settings in the provider's console.
Fixing a Pod Pending: lower the request or add a bigger node
Take an Elasticsearch pod that requests 800m CPU and 1.5Gi RAM on a 1 vCPU/2GB node. CPU is at most about 750m after the CNI is subtracted and RAM is also short, so the pod will never fit this node type, and adding a node of the same type leaves it Pending. Adding a 2 vCPU/4GB node lets it schedule. If the event gives a reason for only some of the nodes, do not conclude anything for the rest yet; read describe node for each. The selection principle, remembering to count memory too:
- Redo the subtraction: the Allocatable of the node type minus the system pods must be larger than the pod's request.
- If the request is higher than real demand, lower it (measure with
kubectl topunder real load). - If the request is reasonable but the node is small, add a larger node instead of many small ones.
A common mistake is to try several request levels in a row, see Pending until the level is small enough, and conclude it is luck. In fact the boundary can be computed with the subtraction above; you only need to know whether that node runs coredns or ingress. Do not lower limits.memory below the real peak just so the pod can be scheduled, because you will trade Pending for OOMKilled.
After adding a node: volume attach errors
For a Pod Pending that has a PVC, adding a node can be followed by FailedAttachVolume. Two common messages and how to read them:
CSINode ... does not contain driver: the new node has not registered the CSI driver yet. Usually temporary; wait a few minutes and check again.Volume with id ... not found: the old PV points to a volume that was deleted at the provider. This is an inference from the message; compare the PV'svolumeHandlewith the real volume.
A commonly documented remedy is to add the node, delete the old PV and PVC, and reinstall that component. This is destructive, so be careful: check persistentVolumeReclaimPolicy with kubectl get pv first; delete only after confirming the volume really no longer exists at the provider (compare volumeHandle) and the data can be rebuilt or has been backed up (for example Prometheus data); delete only the PV and PVC of that component. How to look up volumes on a node is covered in PVCs on the Kubernetes node: finding CSI mounts, measuring disk usage and fixing stuck Terminating PVCs.
Pod Pending diagnostic checklist
- For each Pod Pending, run
kubectl describe podand read the FailedScheduling line, separating "Insufficient cpu" from "Insufficient memory". kubectl get pod -A -o wideto see which node runs what.- For each node:
kubectl describe node, take Allocatable minus the sum of requests. - Compare with the pod's request. If it is larger than the Allocatable of the node type, adding a node of the same type is useless.
- Cross-check
kubectl top nodeto know real usage; do not infer it from request percentages. - Read the full reason of NotTriggerScaleUp and check the node pool's autoscaler.
- After adding a node, check volume attach if the pod has a PVC.
The official documentation on managing resources for containers explains exactly how the scheduler uses requests. For a Laravel website packaged as an image (see Dockerizing Laravel: one all-in-one image for Website AI), set requests according to the needs of the whole container, not just PHP.
Next article
Node out of RAM: slow sites with low CPU, limit overcommit and NotReady nodes. The next article looks at the opposite side of Pod Pending: pods that do run, but the site is still slow because the node's RAM is overcommitted.