FastAPI is a Python web framework built on Starlette and Pydantic, and a popular way to turn an AI model into an HTTP service. Getting it to run in a notebook is only half the journey. The other half is the questions production asks: how does the model handle 32 simultaneous requests, how long before you cut off a stuck request, what happens when the queue fills up, and where do you look to tell whether the service is healthy or slowly degrading? This article builds an embedding service with FastAPI, adds one layer at a time (lifespan, batching, timeouts, backpressure, metrics), and measures each layer with real numbers.
It follows Multimodal LLMs: question answering over images, invoices and scanned documents and LLM evaluation and guardrails: test suites, LLM-as-judge and prompt injection defense, and reuses the embedding model from Embeddings and semantic search: sentence-transformers and FAISS. The real test environment: Apple M4, 16 GB of RAM shared with many other processes (load average between 13 and 16 during measurements), Python 3.12, fastapi==0.128.0, uvicorn==0.40.0, prometheus_client==0.23.1, torch==2.5.1, httpx==0.28.1, and the model intfloat/multilingual-e5-small (about 118 million parameters, 384-dimensional vectors). The code lives in code/s7-47; the route snippets below are trimmed versions of app.py, and the full file also has the no-batching branch and metric recording.
The FastAPI problem: one model, many concurrent requests
An embedding model on CPU or GPU runs most efficiently when it receives a batch of texts, not one sentence at a time. But clients call with one sentence at a time. The FastAPI service has to sit in the middle: accept single requests, group them into batches, run the model, and return each result to the right caller. Four decisions come before writing the FastAPI service:
- Where to load the model: once at startup, reporting "not ready" until loading finishes.
- Where to run the model: inference is heavy work, and running it directly inside an
asyncfunction freezes the whole event loop. - How long to wait at most: every request needs a deadline, otherwise one slow moment leaves hundreds of requests waiting forever.
- What to do under overload: rejecting early with a 503 is cheaper than accepting everything and letting all of it time out.
The FastAPI service skeleton: lifespan and two kinds of probe
According to the FastAPI lifespan documentation, code before yield runs once at startup and code after yield runs at shutdown; the documentation uses loading a machine learning model as its example. The older @app.on_event("startup") style is marked deprecated, and once you pass lifespan, the startup/shutdown handlers are no longer called. Do not mix the two styles.
@asynccontextmanager
async def lifespan(app: FastAPI):
    app.state.model = Model()
    app.state.model.embed(["startup"])  # warm-up: the first run is always slower
    app.state.batcher = Batcher(app.state.model) if BATCHING else None
    app.state.ready = True
    yield
    app.state.ready = False
    if app.state.batcher:
        await app.state.batcher.close()
    del app.state.model

app = FastAPI(title="Embedding service", lifespan=lifespan)

@app.get("/readyz")
def readyz(request: Request):
    if not getattr(request.app.state, "ready", False):
        raise HTTPException(503, "not ready")
    return {"status": "ready", "batching": BATCHING}
Two FastAPI routes serve Kubernetes or a balancer: /healthz (liveness) only answers "the process is alive", while /readyz (readiness) says whether this replica can take traffic yet. The lifecycle matters here: Uvicorn finishes the startup part of lifespan (model loading, warm-up) before it opens the port for connections, so while the model loads the probe gets connection refused, not a 503. Running startup_probe.sh (startup_probe_output.txt) shows the first 28 probes, spread over about 14 seconds, all returned HTTP 000 (curl could not connect), and the 29th returned HTTP 200.
On Kubernetes this is still safe, because a failing probe keeps the pod out of the Service. The ready flag in the code is mostly useful at shutdown (set to False right after yield so the service reports 503 during cleanup), or if you move model loading into a background task so the port opens early. In this FastAPI service, the warm-up runs one dummy inference because PyTorch's first run is always slower. Keep the probes separate so one slow model call does not make the orchestrator kill a healthy container.
Input is validated by Pydantic: texts: list[str] = Field(min_length=1, max_length=8), meaning one to eight texts per request. A curl check (smoke.sh, real output):
{"status":"alive"}
{"status":"ready","batching":true}
{"dim":384,"embeddings":[[0.0648,-0.0486,0.0069,-0.0411],[0.0392,-0.0302,-0.0438,-0.0366]]}
empty texts -> HTTP 422
more than 8 texts -> HTTP 422
The returned vectors are cut to the first four numbers for readability; the real service returns all 384 dimensions. The limit of eight texts per request stops one client from sending a thousand sentences in a single call.
FastAPI must not block the event loop: def, async def, to_thread
This is the most common mistake when serving a model with FastAPI. The async documentation explains that a function declared with def is normally run by FastAPI in an external threadpool and awaited, so it does not block the server. By contrast, an async def that calls blocking code inside (time.sleep(), a synchronous database driver, or a PyTorch model(...) call) blocks the event loop for every request. Model inference is the classic blocking code.
This FastAPI service keeps the /embed route as async def (because it needs to await the queue and asyncio.timeout) and pushes the computation to a separate thread with asyncio.to_thread. Inside that thread, torch.inference_mode() turns off gradient tracking and torch.set_num_threads(2) caps the compute threads so the service does not take every CPU on a shared machine. The inference function tokenizes, runs the model, applies masked mean pooling, then L2-normalizes, with the query: prefix that the E5 model requires.
Dynamic batching in FastAPI: accept single requests, run in batches
Before writing the batcher, measure whether batching is worth it. batch_cost.py calls the inference function directly, without HTTP, taking the median of 15 runs for each batch size:
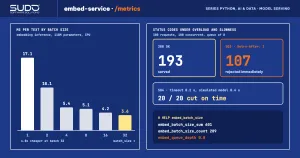
batch | ms/call | ms/text (median of 15 runs)
    1 |    17.1 |   17.1
    2 |    20.2 |   10.1
    4 |    21.8 |    5.4
    8 |    40.8 |    5.1
   16 |    67.5 |    4.2
   32 |   115.8 |    3.6
One single-sentence inference takes 17.1 ms; a batch of 32 sentences takes 115.8 ms, or 3.6 ms per sentence, about 4.8 times cheaper. Going from batch 1 to batch 4 is almost free (17.1 to 21.8 ms), and after that the cost grows roughly linearly with the number of sentences. That is the opportunity for dynamic batching: wait a short moment so requests that arrive close together join the same batch. The price is that each request waits up to that long.
A natural question is whether batching changes the results, since shorter sentences are padded to the length of the longest. padding_check.py compares each sentence's vector computed alone with its vector computed in a batch of 16 sentences of different lengths:
minimum cosine between single and batch: 1.000000
largest absolute difference: 8.29e-08
The difference is on the order of 1e-7, which is floating-point rounding error, because the attention mask and masked mean pooling ignore the padding. With a different model or pooling method, you have to check again.
The batcher is a loop that reads the queue: it takes the first item (waiting indefinitely), sets a MAX_WAIT_MS deadline, then picks up more items until it has MAX_BATCH or the deadline passes. Each item carries a Future so the result goes back to the right request:
async def run(self):
    loop = asyncio.get_running_loop()
    while True:
        items = [await self.q.get()]
        deadline = loop.time() + MAX_WAIT_MS / 1000
        while len(items) < MAX_BATCH and (left := deadline - loop.time()) > 0:
            try:
                items.append(await asyncio.wait_for(self.q.get(), left))
            except TimeoutError:
                break
        live = [(t, f) for t, f in items if not f.cancelled()]
        try:
            vecs = await asyncio.to_thread(self.model.embed, [t for t, _ in live])
            for (_, f), v in zip(live, vecs):
                f.set_result(v)
        except Exception as e:
            for _, f in live:
                f.set_exception(e)
Three details matter (the full version in app.py also checks f.done() and updates the gauge). First, put_nowait on a bounded queue raises asyncio.QueueFull when it is full, and that is exactly the backpressure mechanism (covered below). Second, before running the model, the loop drops items whose Future was cancelled, meaning the client left or the request timed out, so you do not compute for someone who is no longer waiting. Third, a model error is assigned to each Future instead of being raised out of the loop: if an exception escapes run(), the background task dies silently and every later request hangs until its deadline.
FastAPI timeouts: a deadline for every request
The FastAPI route wraps all the work in asyncio.timeout(REQUEST_TIMEOUT_S). According to the asyncio documentation, when the deadline passes it cancels the current task and turns the CancelledError into a TimeoutError, which can only be caught outside the async with block; since Python 3.11, wait_for also raises TimeoutError instead of asyncio.TimeoutError. The route turns that error into an HTTP 504:
@app.post("/embed")
async def embed(body: EmbedIn, request: Request):
    try:
        async with asyncio.timeout(REQUEST_TIMEOUT_S):
            b: Batcher = request.app.state.batcher
            vecs = await asyncio.gather(*(b.submit(t) for t in body.texts))
        return {"dim": len(vecs[0]), "embeddings": [[round(x, 4) for x in v[:4]] for v in vecs]}
    except asyncio.QueueFull:
        raise HTTPException(503, "queue full", headers={"Retry-After": "1"})
    except TimeoutError:
        raise HTTPException(504, f"exceeded {REQUEST_TIMEOUT_S}s")
For a FastAPI request with several texts, the real code wraps the submit calls in separate tasks and cancels the sibling tasks when one submit raises QueueFull; with a bare asyncio.gather, the error escapes but the items already queued are still computed for a request that received a 503. Running multi_cancel_check.sh (one 8-text request into a queue of size 2) returns HTTP 503 and only 1 batch of 1 text (the warm-up) in the metrics, which means no inference ran for the rejected request.
One limit to understand: cancelling an await on to_thread only stops the waiting, while the function already running in the thread cannot be forcibly stopped and runs until it returns. This is general Python threading behavior, and the asyncio documentation does not mention it. So a timeout protects the client (it gets its 504 on time) and the queue (cancelled items are skipped), but it cannot reclaim the CPU of a batch that is already running. To really stop work, you need a separate process or a model that supports interruption.
To verify, force the model to be slow with a simulated 400 ms delay (the FAKE_DELAY_MS variable, for testing only) and a 0.2 s deadline; 20 requests, 4 concurrent (bench_timeout_output.txt):
n=20 conc=4 total=1.06s throughput=18.8 req/s p50=203ms p95=240ms p99=240ms codes={504: 20}
  code 504: p50=203ms max=240ms
embed_requests_total{status="504"} 20.0
embed_batch_size_count 3.0
embed_batch_size_sum 9.0
All 20 requests got a 504 after about 203 ms, on time even though the model needs 400 ms. The final numbers show the effect just described: the model still finished 2 batches (8 texts) for requests that had already been cut off; the counts of 3 batches and 9 texts above include the 1-text warm-up at startup.
FastAPI backpressure: reject early under overload
An unbounded queue hides overload: latency grows without limit, memory grows, and by the time the model reaches a request the client left long ago. A bounded queue forces the service to be honest: QUEUE_SIZE slots, and beyond that it returns a 503 with Retry-After so the client knows to retry. Test with a queue of only 8 slots, a maximum batch of 4, and 300 requests at 100 concurrent (bench_backpressure_output.txt):
n=300 conc=100 total=5.25s throughput=57.1 req/s p50=880ms p95=4873ms p99=5110ms codes={503: 111, 200: 189}
  code 200: p50=1789ms max=5150ms
  code 503: p50=213ms max=5116ms
111 requests were rejected with a 503 and 189 were served (the numbers differ a little on each run because the machine is shared). The long latency tail (p95 close to 5 seconds) comes from 100 concurrent connections running on a busy shared machine; the queue limits items, not connections. This is why protection sits at several layers: besides the in-app queue, Uvicorn has the --limit-concurrency option, which according to the Uvicorn documentation is the "maximum number of concurrent connections or tasks to allow, before issuing HTTP 503 responses", and --backlog is the queue for accepting TCP connections; --timeout-graceful-shutdown sets the maximum wait at shutdown so in-flight requests can finish. At the outermost layer, an Nginx reverse proxy has its own timeouts too.
Monitoring FastAPI with Prometheus metrics
The FastAPI service exposes metrics at /metrics using prometheus_client, with a dedicated CollectorRegistry so they do not mix with the default process metrics. Five metrics are enough to answer most operational questions:
| Metric | Type | Question it answers |
|---|---|---|
embed_requests_total{status} | Counter | How many requests succeeded, got a 503, got a 504? |
embed_request_seconds | Histogram | What latency do users see, p50 and p95? |
embed_batch_size | Histogram | Is batching actually grouping anything? |
embed_inference_seconds | Histogram | How long does the model take, separate from queue wait time? |
embed_queue_depth | Gauge | How full is the queue? |
According to the client_python documentation, a Histogram exports three series, _bucket{le=...}, _sum and _count, accepts custom buckets= (always increasing, with +Inf added automatically), and the label name le is reserved. Here the buckets follow the service's scale: 10 ms to 5 s for requests, 5 ms to 1 s for inference. The Prometheus histogram guide makes two points worth remembering: quantiles are computed server-side with histogram_quantile(), and the error is bounded by the width of the bucket that contains the quantile, so sparse buckets around your SLO threshold give an imprecise p95.
Only status is a label, a small fixed set. Labels such as user_id or the text content create countless time series and bring Prometheus down. The _sum and _count pair of embed_batch_size gives the average batch size immediately: in the batching run, 601 / 209 is about 2.9 texts per batch. Building the dashboard is covered in Kubernetes monitoring with kube-prometheus and Grafana.
Real FastAPI load test: does batching win?
loadtest.py uses httpx to fire 600 requests at the FastAPI service, one sentence each, 32 concurrent; run_bench.sh starts the service in each configuration, waits for /readyz, runs the load, prints the metrics, then shuts it down. The numbers from /metrics include one warm-up call, so they count 601. The result of the cleanest run:
== khong_batching (BATCHING=0)
n=600 conc=32 total=4.01s throughput=149.8 req/s p50=191ms p95=338ms p99=428ms codes={200: 600}
embed_inference_seconds_count 601.0
embed_inference_seconds_sum 54.83518085199648
== co_batching (BATCHING=1)
n=600 conc=32 total=5.57s throughput=107.7 req/s p50=223ms p95=760ms p99=1286ms codes={200: 600}
embed_batch_size_count 209.0
embed_batch_size_sum 601.0
embed_inference_seconds_sum 3.748447908998969
This result does not show batching winning on throughput. The machine is shared, so the numbers swing a lot. Repeating both modes three times (bench_lap_lai_output.txt), throughput without batching was 79.0, 90.2 and 74.1 req/s, with batching 68.0, 105.1 and 61.2 req/s, and the p95 with batching was always higher (824 to 1495 ms versus 606 to 789 ms). Conclusion: at small scale on CPU, the two modes have similar throughput, and the difference is within measurement noise.
What is stable across runs is the total inference time: without batching it takes 54.8 to 111.7 seconds cumulative over 601 calls, with batching only 3.7 to 7.7 seconds over 167 to 216 calls. The no-batching figure is large because many PyTorch threads compete for a few busy CPU cores. Batching turns that contention into one large inference at a time, so it uses less CPU for the same amount of work. The throughput benefit may be clearer on a GPU, but that part needs a GPU and was not run in this article.
The cost of batching at low load, though, is clearly measurable. One client calling 100 requests sequentially (bench_tai_thap_*_output.txt):
tai_thap_co_batching:    p50=25ms p95=51ms p99=105ms
tai_thap_khong_batching: p50=18ms p95=30ms p99=38ms
Batching adds about 7 ms at p50, close to MAX_WAIT_MS=8: every lone request waits the full collection window even when nobody else arrives. That is the core tradeoff: MAX_WAIT_MS is the latency you pay in exchange for efficiency at high load. A service with low load where latency matters should keep the window very short or turn batching off.
When not to write your own batcher in FastAPI
- Text generation models (LLMs): output lengths differ, so static batching wastes work; use a server with continuous batching such as vLLM (needs a GPU, not run in this article).
- Multiple FastAPI processes: each process has its own queue,
--workers Nduplicates the model in RAM, and batching only groups within each process. - A model that is already fast enough: if a single 17 ms call meets your target, a batcher only adds complexity to the FastAPI service.
Common mistakes when serving a model with FastAPI
- Running inference inside
async defwithout pushing it to a thread: the whole server stalls,/healthzincluded, and then the orchestrator kills the container. - Loading the model in every request or at module level: slow, memory-hungry, and hard to test; use lifespan.
- No warm-up: the first user pays the initialization latency.
- An unbounded queue: overload turns into unbounded latency instead of a clear 503 error.
- An exception escaping the batcher loop: the background task dies and every later request hangs until it expires; assign the error to the
Future. - Labeling metrics with unbounded values: the number of time series explodes.
- Drawing conclusions from a single measurement: numbers on a shared machine swing a lot.
Checklist for putting a model on FastAPI
- The FastAPI service loads the model in
lifespan, and the port opens only after loading and warm-up finish (probes see connection refused until then);/readyzswitches to 503 at shutdown;/healthzis separate. - Heavy computation runs outside the event loop (
to_thread, or adefroute), with the library's thread count capped. - Every FastAPI request has an
asyncio.timeoutand returns 504; cancelled items are not computed. - The queue is bounded and returns 503 with
Retry-After; add--limit-concurrencyand a timeout at the proxy in front. - Metrics: a counter by status code, a latency histogram, batch size, inference time, and a queue depth gauge; buckets set to the real scale.
- Measure repeatedly and record the machine configuration.
To install the FastAPI service: python3.12 -m venv .venv && .venv/bin/pip install -r requirements.txt, then run ./smoke.sh and ./run_bench.sh in code/s7-47; the *_output.txt files are the output pasted above. For more, see the FastAPI deployment concepts.
Next article
Inference optimization: ONNX export, quantization and CPU execution. Batching makes a single inference run more efficiently; the next step is making that inference itself faster and lighter with ONNX Runtime and quantization.